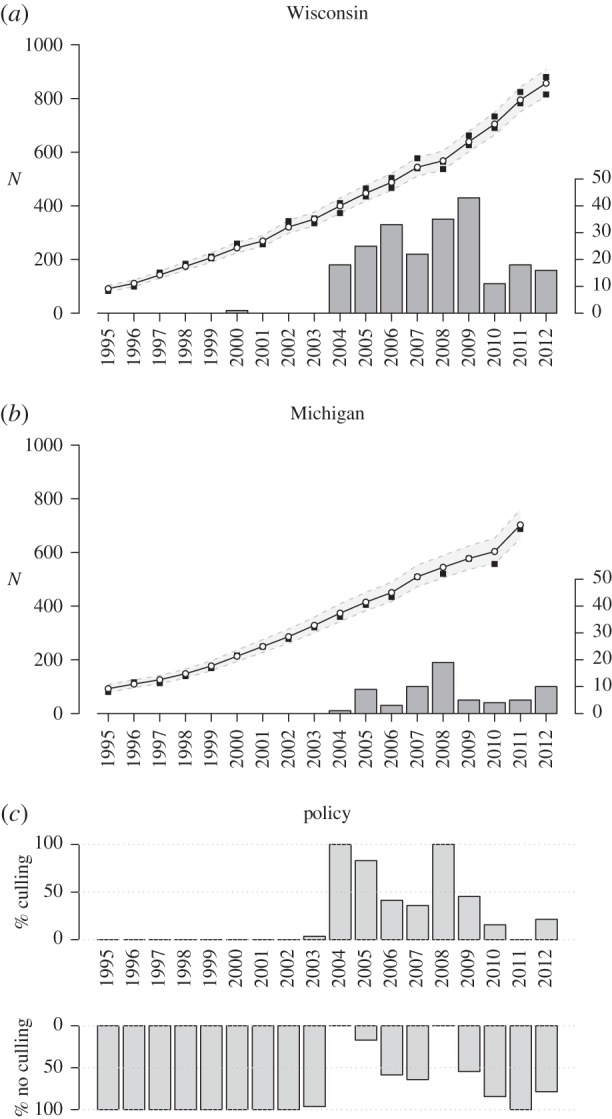
Figure 1.

Wolf population history in Wisconsin (top) and Michigan (middle) and policies (bottom). The black squares are FWS population counts (scale on left axis, minimum and maximum for Wisconsin, minimum for Michigan), the grey area is the 95% credible interval of the fitted population model, the histogram shows the number of wolves culled (scale on right axis). The bottom panel shows the proportion of each year in which culling was allowed (or not). Some wolves were killed legally when culling was not allowed (e.g. year 2011) because the FWS allows killing individuals of an endangered species ‘to protect himself or herself, a member of his or her family, or any other individual from bodily harm’ (ESA §11(a)(3)).
