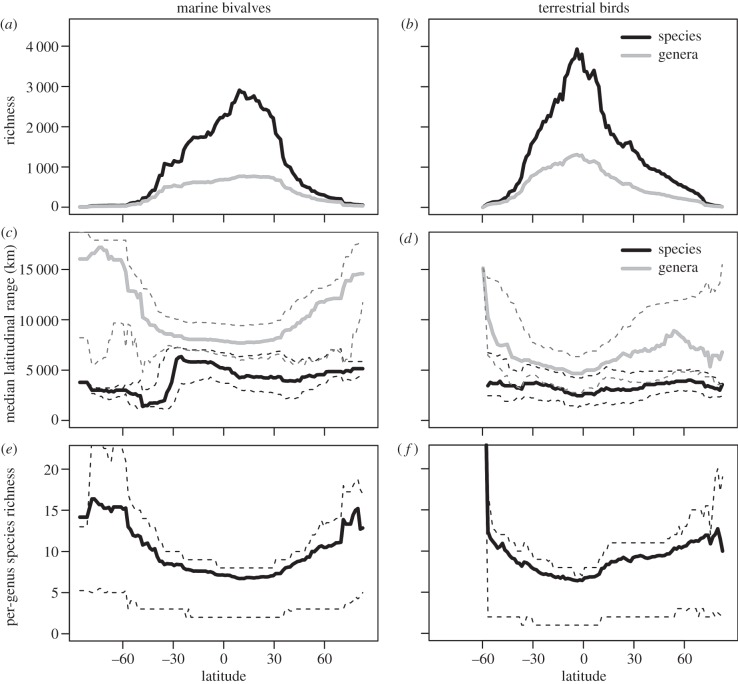
Figure 2.
(a,b) Latitudinal gradients in the richness of species and genera. (c,d) Latitudinal gradients in median species and genus latitudinal range size. (e,f) Latitudinal gradients in the mean number of species within genera (species–genus ratio) that are found at a given latitude (all species in each genus are tallied, not just the species at a given latitude). All figures are plotted at the resolution of 1° latitudinal bands. Dashed lines represent 25th and 75th percentiles of underlying range-size frequency distributions and per-genus richness frequency distributions. Latitudinal gradients in per-genus species richness are markedly congruent between bivalves and birds.

