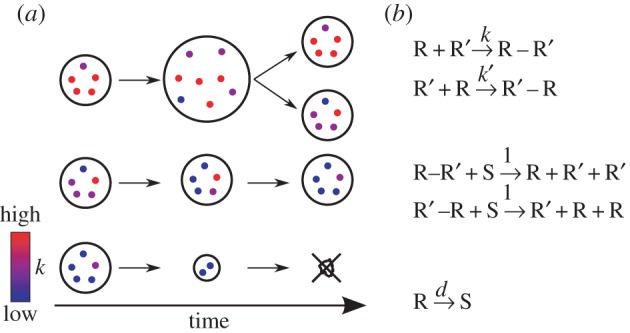
Figure 1.

Schematic of the model. (a) Protocells containing replicating molecules (substrates are not shown). Colours indicate the catalytic activity of molecules k. A protocell with high-k molecules grows and divides (top) and that with low-k molecules shrinks and dies (bottom). Molecules within a protocell evolve toward decreasing k (middle). (b) Reaction scheme. R (R′): replicating molecules, R–R′ (R′–R): complex, S: substrate. Each replicating molecule is assigned a unique complex formation rate  . Any pair of molecules can form a complex. Each pair can form two distinct complexes depending on which molecule serves as a catalyst or template, as indicated by prime symbols (top). The complex formation rate is given by the k value of the catalyst. Replication produces a new molecule, whose k value is copied from the template (middle). This k value is slightly modified by a mutation with a probability m per replication (see Model). The k values of all molecules were initially set to unity at the beginning of each simulation. All molecules decay at the rate d (bottom). m = 0.01 and d = 0.02 unless otherwise stated. (Online version in colour.)
