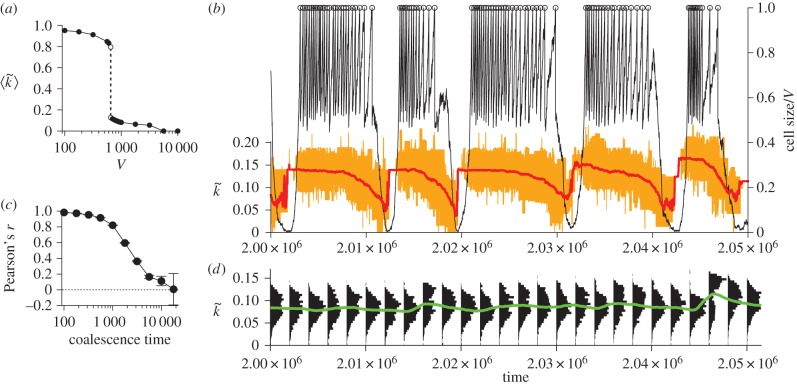
Figure 2.
Evolutionary oscillation. (a) The average intracellular catalytic activity of protocells (denoted by  ) as a function of V. The intracellular catalytic activity of a protocell (denoted by
  ) was defined as the average k of its internal molecules. When protocells went extinct,
  is zero. (b) The dynamics of a protocell lineage along its line of descent for V = 1 000. The displayed lineage refers to the common ancestors of a population at time 2.5 × 10⁶. Colour coding: normalized cell sizes (black); cell division (circle);
  (red); the ranges of k of internal molecules (orange). (c) The correlation coefficient of
  between protocells as a function of coalescence time (error bars, 99% CI; see Methods). (d) The frequency distributions of
  (black), and its average 〈k〉 (green) in protocell populations. (Online version in colour.)

