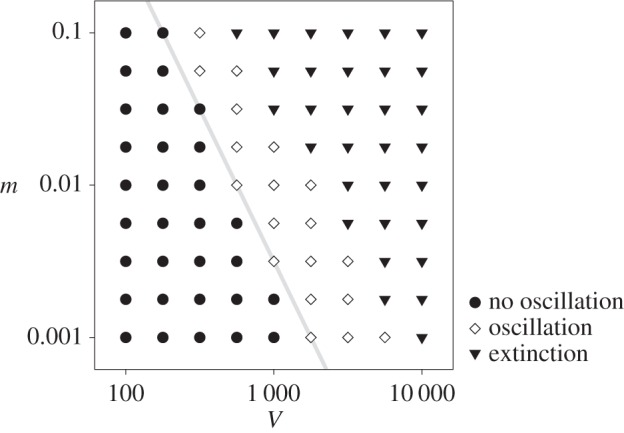
Figure 4.

Phase diagram with respect to V and m. The boundaries between the parameter regions where the evolutionary oscillation occurs (diamond) and where it does not occur (circle) has approximately the same slope as that of mV2 = const. (grey line); extinction (triangle). See Methods for the details of the computation and parameters.
