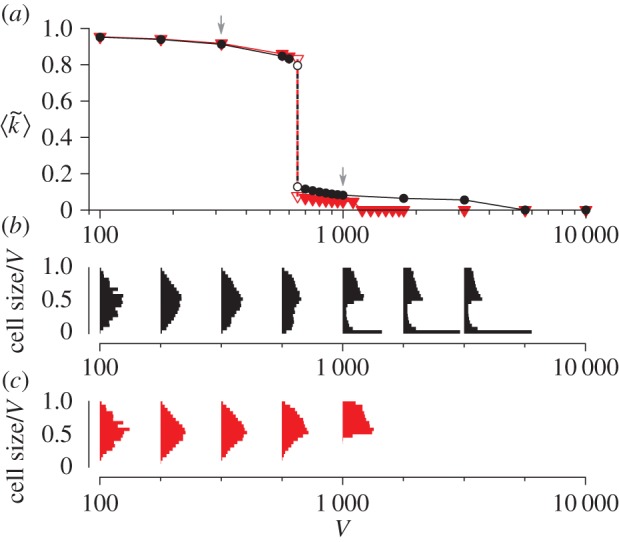
Figure 5.

The effect of preventing the evolutionary oscillation. (a) The average intracellular catalytic activity as a function of V. Symbols: the original model (circle), the model in which the evolutionary oscillation was prevented by killing small protocells (triangle). The arrows indicate V = 1 000 (used in figure 2b–d) and V = 316 (used in figure 3). Unfilled symbols indicate meta-stable states. When protocells went extinct,  is zero. (b,c) The frequency distributions of the cell sizes (scaled by V) of common ancestors as a function of V. The original model (b). The model in which the evolutionary oscillation was prevented (c). The bimodality of distributions indicates the occurrence of evolutionary oscillation (V ≥ 1 000 in b). (Online version in colour.)
