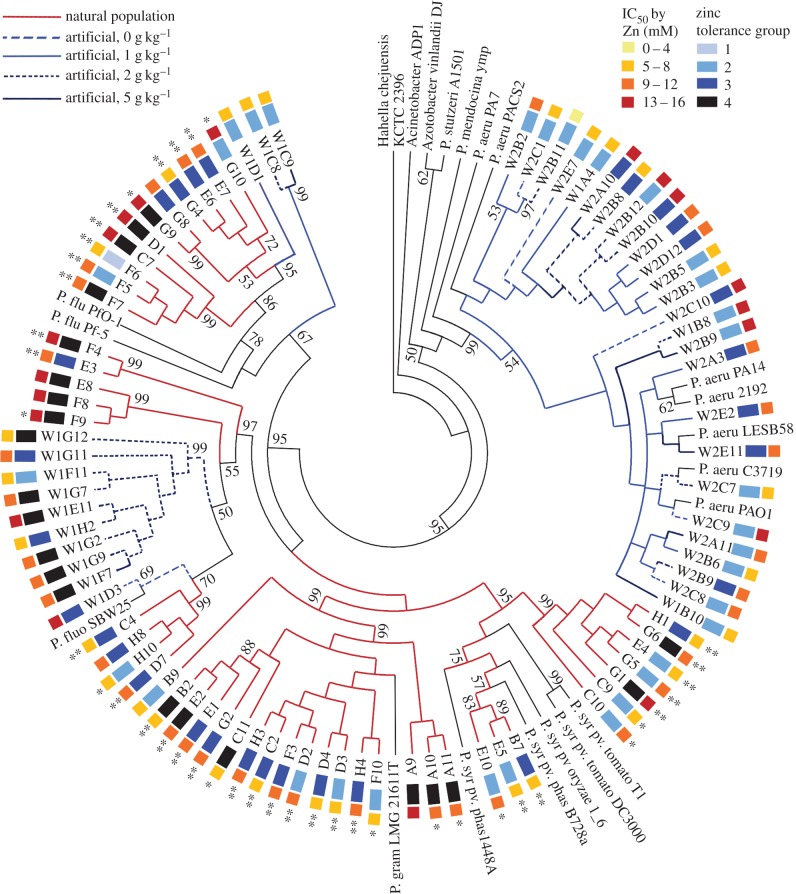
Figure 2.
rpoD gene tree of Wytham and Snowdonia strains. The bootstrap consensus tree from 120 most parsimonious trees is shown. The percentage of replicate trees in which the associated taxa clustered together in the bootstrap test (500 replicates) is shown next to those branches where the bootstrap value exceeds 50% [27]. Branches are coloured red for endophytes of plants from the natural population in Snowdonia and blue for endophytes of plants from the artificial population at Wytham. Within the natural population, ** indicates that the plant from which the endophyte was isolated was symptomatic, whereas * indicates that the plant was from the same spatial sub-population as the symptomatic plants; no asterisk indicates that the isolate was from the asymptomatic sub-population. Within the artificial population, blue branches are further colour-coded to indicate the zinc treatment applied to the plant from which the endophyte was extracted (light blue: dashed: no added zinc, solid: 1 g zinc added per kilogram of soil; dark blue: dashed 2 g kg−1, solid: 5 g kg−1). Zinc tolerance groups based on groupings for all strains on KB are shown in black and shades of blue, with group 4 (highest) in black, through to group 1 (lowest) in pale blue. Zinc concentrations giving IC50 for strains are indicated with a heat map where red is highest (13–16 mM Zn) and yellow lowest (0–4 mM).

