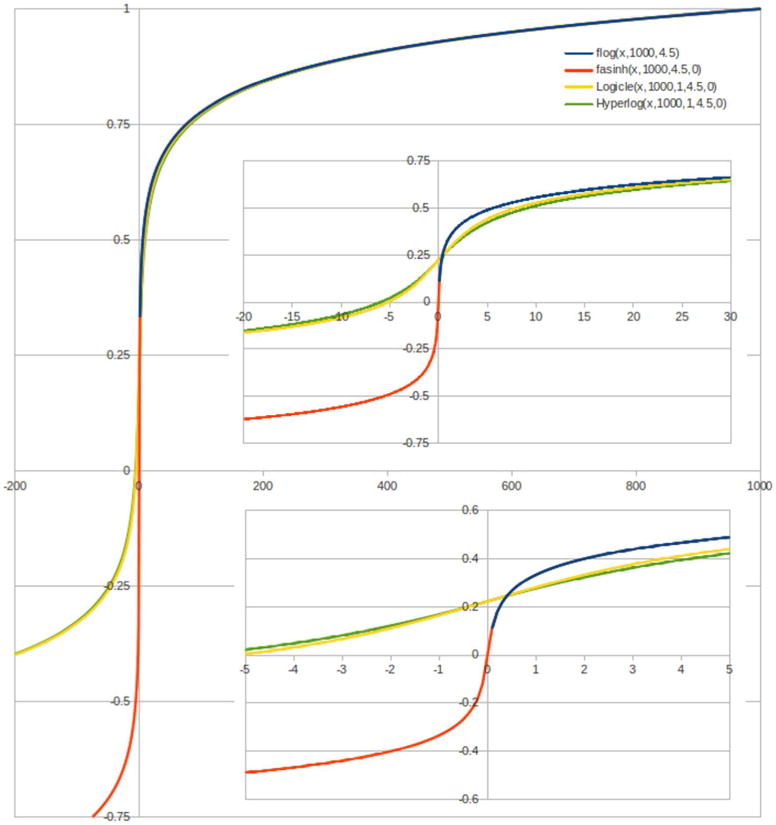
Figure 1.

Comparison of non-linear scale transformations. All transformations are very similar in the far positive range, where they approximate the logarithmic scale. In the low data range (zoomed-in in the two sub figures), the parameterized inverse hyperbolic sine, Logicle, and Hyperlog transforms show a linear-like behavior around zero and extend the scale to the negative data range. The similarity of these transformations guides a sensible fall back strategy when software does not implement a particular scale.
