. 2016 Apr 8;5:e14119. doi: 10.7554/eLife.14119

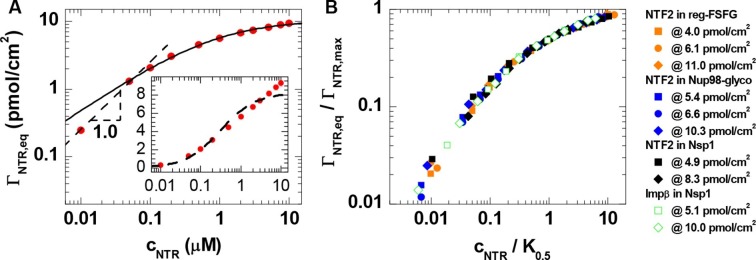
Figure 2. Quantitative analysis of the binding isotherms.

(A) A selected data set (NTF2 binding to 6.1 pmol/cm2 reg-FSFG; symbols) with fits to simple binding models (lines). Data at low NTR concentration (cNTR ≤ 0.05 μM) display a close-to-linear relation (dashed line with slope 1.0 in the log-log plot), as expected for independent binding, yet the Langmuir isotherm (inset, dashed line in lin-log plot) fails to reproduce the data over the full range of NTR concentrations. The Hill equation provides a good description of the data in the high-concentration range (0.05 μM ≤ cNTR ≤ 10 μM; solid line). (B) By normalizing the areal densities and NTR concentrations to ΓNTR,max and K0.5, respectively, all data could be overlaid on a single master curve, where the effective maximal binding ΓNTR,max and the half-maximal binding K0.5 were determined from fits with the Hill equation (see main text and Figure 2—figure supplement 1).

DOI: http://dx.doi.org/10.7554/eLife.14119.012

Figure 2.

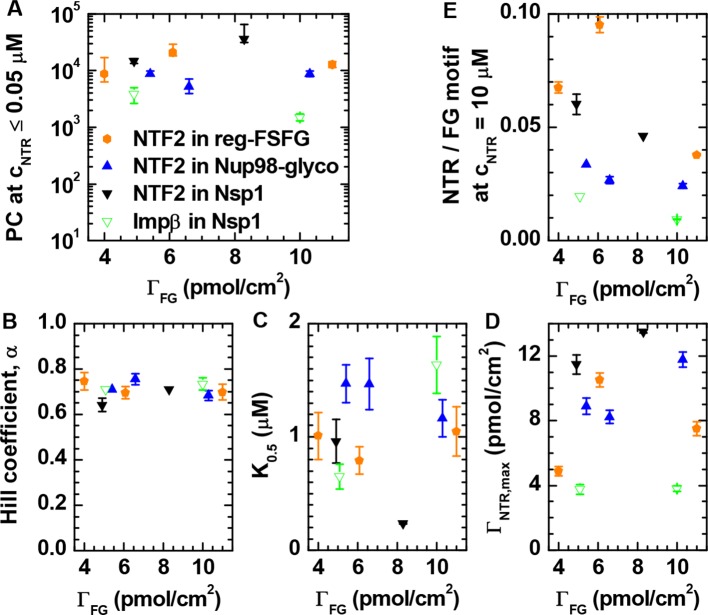
Figure 2—figure supplement 1. Quantitative analysis of the binding isotherms in Figure 1.

Figure 2—figure supplement 1.

Analysis as a function of NTR and FG domain types (visualized by distinct symbols and colors, as indicated in A) and grafting density ΓFG. (A) Partition coefficients PC were obtained from a linear fit to the data at cNTR≤ 0.05 μM. (B-D) Results of fits with the Hill equation, i.e., the Hill coefficient α, the concentration for half maximal binding K0.5 and the effective maximal binding ΓNTR,max. In a first step, seven data sets where selected for which data covered the full range of 0.05 μM ≤ cNTR ≤ 10 μM, and fitted over 0.05 μM ≤ cNTR ≤ 10 μM with α, K0.5 and ΓNTR,max as adjustable parameters. From this analysis, a mean value of α = 0.71 ± 0.04 was determined. In a second step, an equivalent analysis was performed for the remaining three data sets, for which the experimental data did not cover the full concentration range (i.e., NTF2 on 5.4 pmol/cm2 Nup98-glyco, NTF2 on 8.3 pmol/cm2 Nsp1, and Impβ on 5.1 pmol/cm2 Nsp1), with α = 0.71 fixed. By thus fixing α, we prevented a scatter of the fit parameters that would only be due to the limited input data. (E) Ratio of NTR bound per FG motif at cNTR = 10 μM; the three data points not directly measured were obtained through extrapolation using the Hill equation.