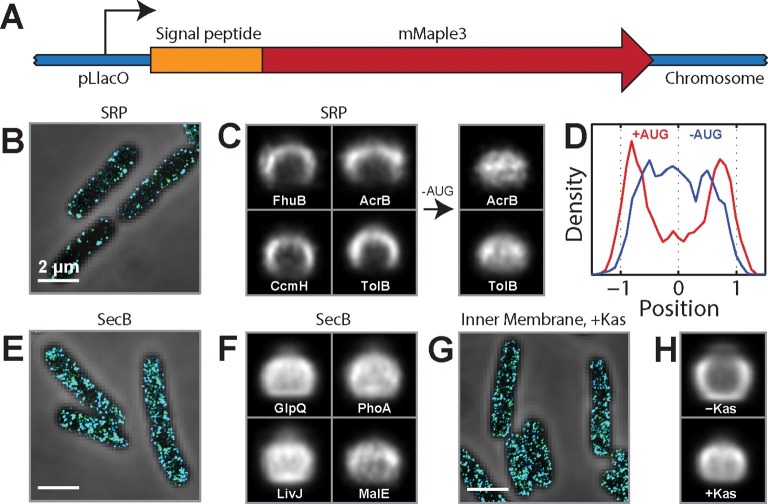
Figure 3. SRP-dependent co-translational insertion of signal peptides plays a major role in the membrane localization of inner-membrane-protein mRNAs.
(A) Fusion constructs between different signal peptides and mMaple3. (B) Stacked phase contrast (gray) and STORM cross-section images (color) of example E. coli cells expressing mMaple3 fused to the signal peptide from an SRP-dependent protein FhuB. The cells were stained with FISH probes against mMaple3. (C) Left: Average long-axis cross-section images of cells expressing mMaple3 fused to SRP-dependent signal peptides derived from FhuB, CcmH, AcrB, and TolB. Right: Average long-axis cross-section images of cells expressing mMaple3 fusions to AcrB and TolB signal peptides without the start codon (-AUG). (D) Density profiles derived from the average long-axis cross-section images of mMaple3 fusions to the AcrB signal peptide with (red) and without (blue) the start codon. Density profile is as defined in Figure 1E. (E) Stacked phase contrast and STORM cross-section images of example E. coli cells expressing mMaple3 fused to a signal peptide derived from a SecB-dependent protein GlpQ. The cells were stained with FISH probes against mMaple3. (F) Average long-axis cross-section images of cells expressing mMaple3 fused to SecB-dependent signal peptides derived from GlpQ, LivJ, PhoA and MalE. (G) Stacked phase contrast and STORM cross-section images for example E. coli cells treated with the translation-initiation-inhibitor kasugamycin. The cells were stained with the FISH probe set against inner-membrane-protein mRNAs in the abundance range of 3–30 copies per cell. (H) Average long-axis cross-section images of cells in the presence (+Kas) and absence (-Kas) of kasugamycin. The cells were stained with the FISH probes against inner-membrane-protein mRNAs in the abundance range of 3–30 copies per cell. Average long-axis cross-section images in C, F and H were derived from all measured cells, tens to hundreds of cells in each case. Scale bars: 2 µm.


