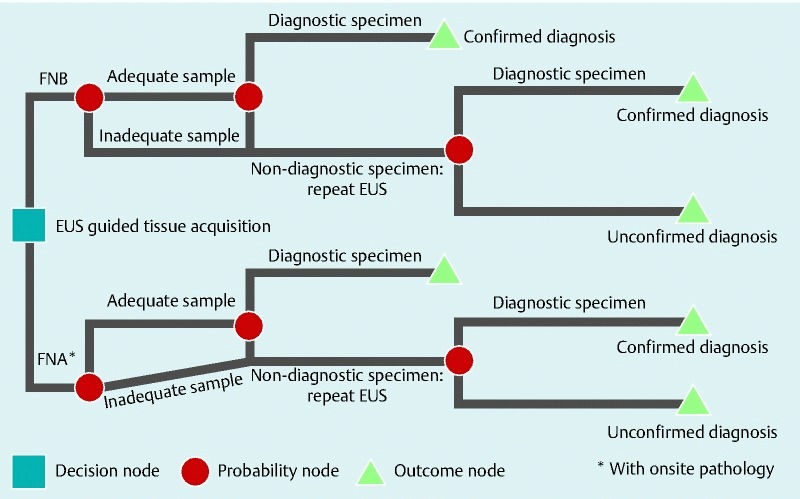
Fig. 2.

Decision analysis tree showing the structure of the decision analysis model comparing the two competing strategies: EUS-FNB and EUS-FNA. In the decision tree, squares, circles, and triangles represent decision, probability and outcome nodes, respectively.
