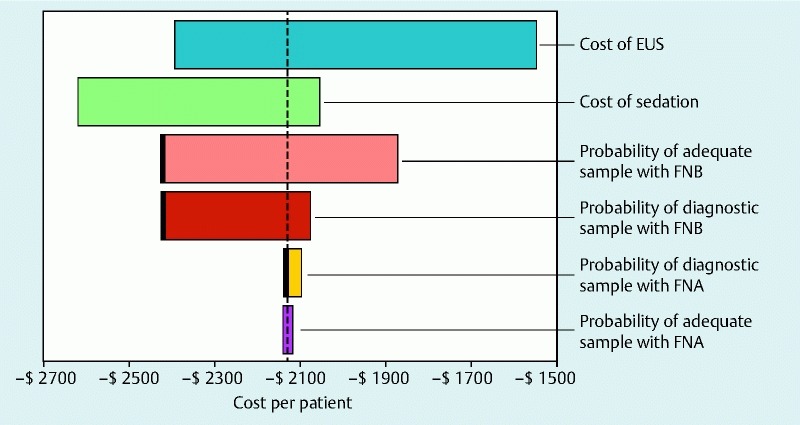
Supplementary Fig. 1.

Tornado diagram examining the impact of important cost and outcome variables on the results of the decision analysis, with cost per patient along the X axis. In the tornado diagram, the uncertainty in the parameter associated with the largest bar, the one at the top of the chart has the maximum impact on the result, with each successive lower bar having a lesser impact. Also, thick vertical lines in the tornado diagram identify the threshold points where EUS-FNA becomes more economical (i. e. model conclusion is reversed). When the probability of adequate sampling by EUS-FNB falls below 0.38, probability of diagnostic yield of EUS-FNB falls below 0.65 and the probability of diagnostic yield of EUS-FNA is higher than 0.87. Similar results were noted for pancreatic and non-pancreatic masses.
