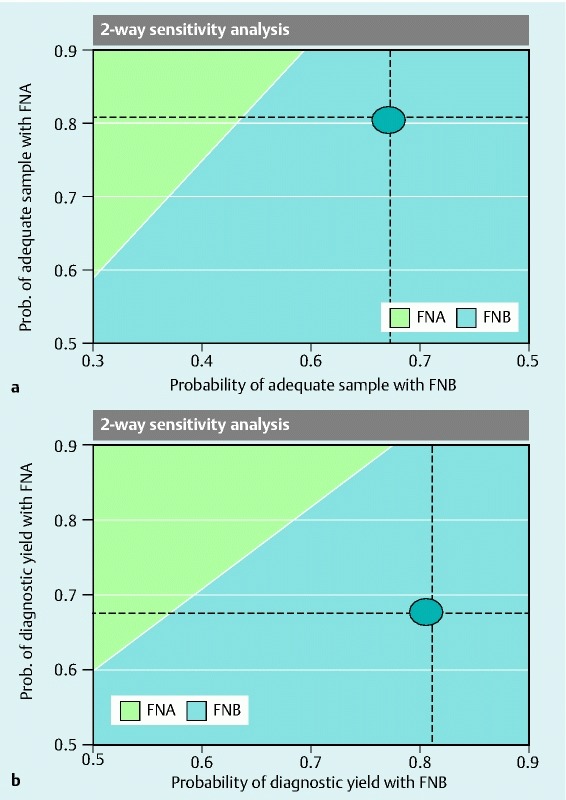
Supplementary Fig. 2 a.

and b Results of a two-way sensitivity analysis with the X axis showing probability of adequate sampling by EUS-FNB and the Y axis showing probability of adequate sampling of EUS-FNA. When both these variables are simultaneously varied in the model, and the output of the model is plotted, any point in the blue shaded area favors EUS-FNB-based strategy and any point in the green cross-hatched area favors EUS-FNA-based strategy. Similarly, Supplementary Fig. 2 b shows the result of a two-way sensitivity analysis with the X axis showing probability of diagnostic yield by EUS-FNB and the Y-axis showing probability of diagnostic yield of EUS-FNA. Blue circles in both figures represent when the data from the current RCT were plotted. It is evident that in a wide range of possibilities of these parameters around the point derived from this study, the EUS-FNB-based strategy is more economical. Similar results were noted for pancreatic and non-pancreatic masses.
