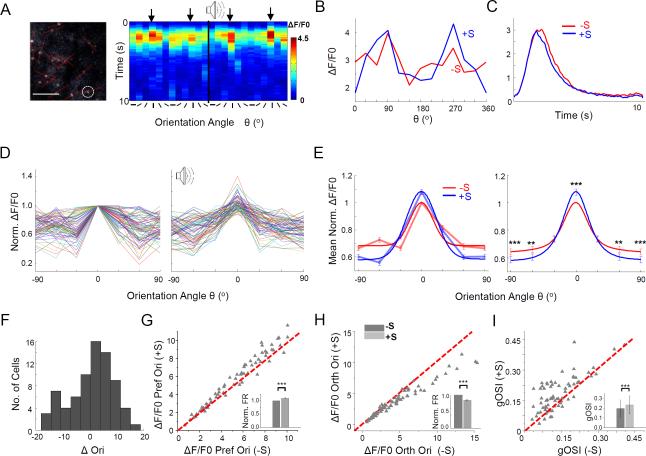
Figure 2. Sound-induced sharpening of OS revealed by two-photon Ca2+ imaging.
(A) Left, an example image plane in L2/3 (250 μm below the pia). Red lines were used to guide line scanning across labeled cell bodies. Scale bar: 100 μm. Right, color map of ΔF/F0 (average of 5 repetitions) over an imaging period of 10 sec for 12 stimulus directions, plotted for an example cell (marked with a white circle on the left image). Time zero represents the onset of visual stimuli. Orientation is indicated by a black line below the color map. The first block shows visual responses alone; the second shows the responses to visual plus sound stimulation. Black arrows point to the preferred orientation.
(B) Tuning curves of peak ΔF/F0 for the cell shown in (A).
(C) Average Ca2+ responses across all orientations for the same cell.
(D) Tuning curves of normalized peak Ca2+ response amplitude plotted for 75 imaged L2/3 cells in the absence (left) and presence (right) of sound. Tuning curves were aligned according to the preferred orientation determined in the sound-off condition.
(E) Left, average normalized Ca2+ response levels of all the cells. Bright red and blue curves represent the Gaussian fits. Right, average of Gaussian fits of individual cell tuning curves. **, p < 0.01; ***, p < 0.001, Wilcoxon signed-rank test.
(F) Histogram of differences in preferred orientation between sound-off and sound-on conditions for cells included in analysis. Preferred orientations were determined from Gaussian fits.
(G-I) Plots of ΔF/F0 at the preferred (G) and orthogonal orientation (H), as well as of gOSI value (I) in the sound-on versus sound-off condition (n = 75 cells). Insets, mean normalized evoked Ca2+ response levels (G, H), or mean gOSI values (I). ***, p < 0.001, Wilcoxon signed-rank test. Error bar = SEM (G, H) or SD (I).

