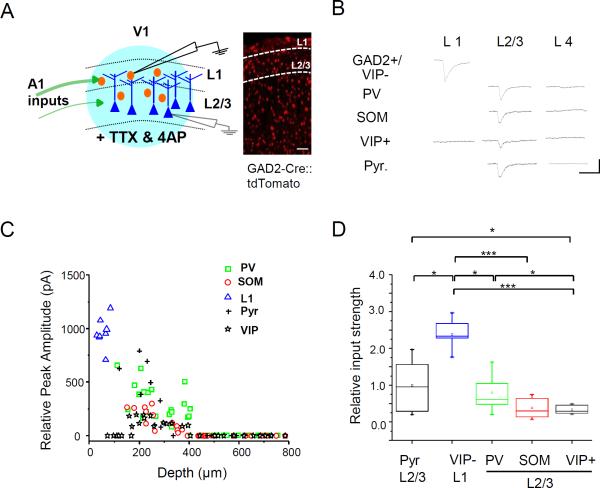
Figure 4. L1 neurons receive maximum A1 input.
(A) Left, schematic diagram of whole-cell recordings in a slice preparation. The thickness of green arrows represents density of A1 axons in each layer. Red, inhibitory neuron; dark blue, pyramidal neuron; light blue, LED illumination. Right, fluorescence-labeled inhibitory neurons in V1 of a GAD2-Cre::tdTomato mouse. Scale bar, 200 μm.
(B) Average excitatory postsynaptic current (EPSC) traces of example neurons of different types in different layers evoked by LED stimulation. Note that in L1, VIP+ cells did not show EPSCs. Scale: 50 pA, 50 ms.
(C) Relative peak EPSC amplitudes of all the recorded cells versus their depths. Blue marks VIP-negative L1 neurons.
(D) Summary of relative strength of A1 input to different types of neurons (n = 12 for pyramidal, 9 for VIP- L1, 19 for PV, 12 for SOM, 10 for VIP+ L2/3). Small box, mean value; large box, SD; whisker, full range; line, median. *, p < 0.05; ***, p < 0.001, one-way ANOVA and post hoc test.

