
Figure 1.
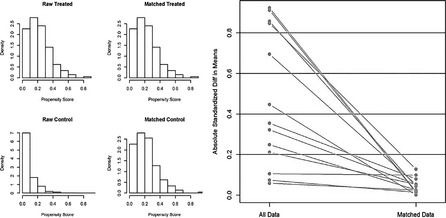
Matching Diagnostics Following Propensity Scoring for Magnet Recognition
- Note. The histograms on the left show the distributions of propensity scores for the non‐Magnet and Magnet hospitals before (left) and after (right) matching. The figure on the right shows the absolute standardized difference in means of the covariates before and after matching.
- Source. Authors' analysis of the American Hospital Association Annual Survey and American Nurses Credentialing Center list of Magnet hospitals.