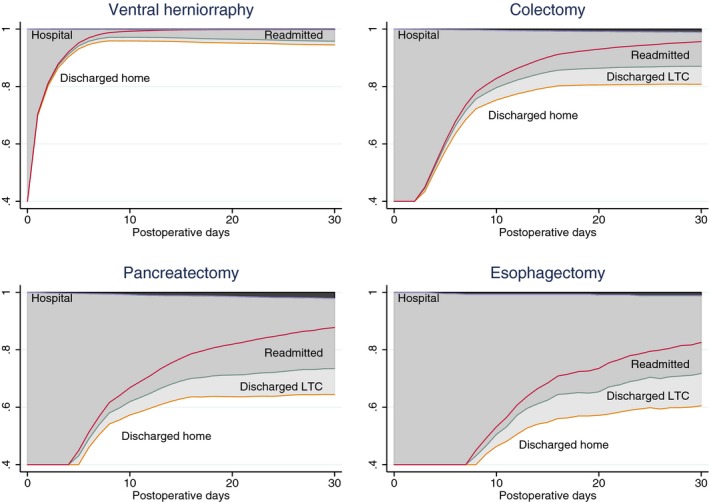
Figure 2.

Depiction of Simulated Outcomes from the Multistate Model for Elective Surgical Patients after Ventral Herniorraphy, Colectomy, Pancreatectomy, or Esophagectomy. Mortality is shown by the dark shaded areas of the graphs. Length of stay in a hospital or in long‐term care (LTC) can be visualized as the lighter shaded areas of the graphs
