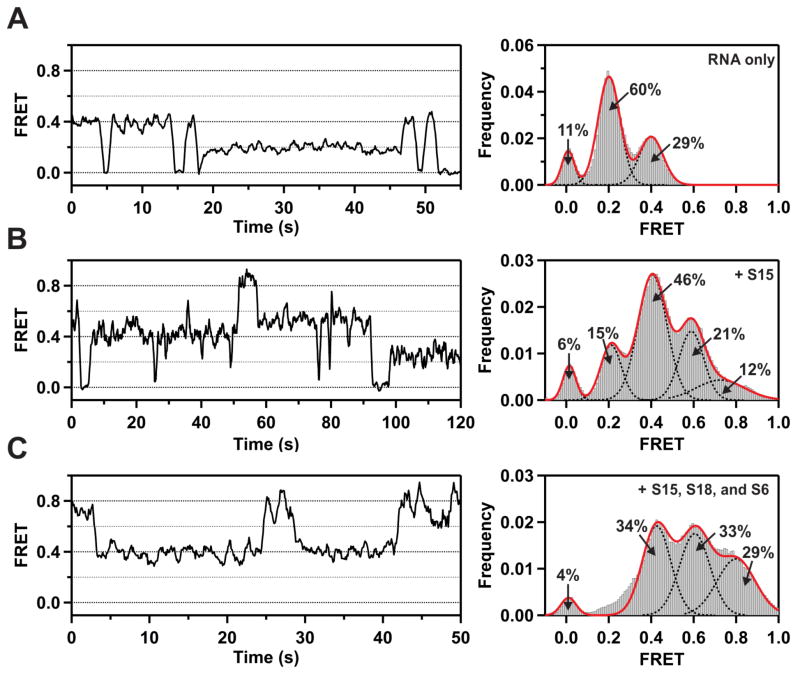
Figure 4.
Single-molecule FRET data obtained under various experimental conditions. (A) Representative FRET trajectory of an individual RNA molecule in the absence of any proteins (left). Histogram of FRET efficiencies compiled from 111 individual RNA molecules (right). The dashed black lines are Gaussian fits to individual peaks, with percentage populations as indicated, and the solid red line is the composite fit to the overall histogram. (B) Representative FRET trajectory (left) and histogram of FRET efficiencies compiled from 145 individual RNA molecules (right) in the presence of ribosomal protein S15 (20 nM). Other details are as in panel (A). (C) Representative FRET trajectory (left) and histogram of FRET efficiencies compiled from 152 individual RNA molecules (right) in the presence of ribosomal proteins S15 (20 nM), S16 (30 nM) and S18 (30 nM). Other details are as in panel (A).

