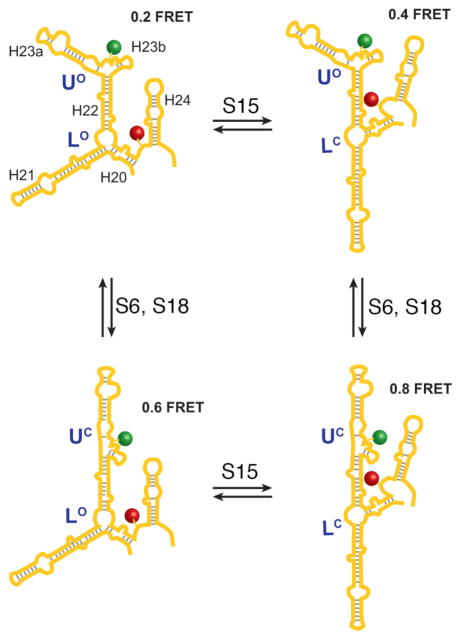
Figure 5.
Model for protein binding-induced folding of the junctions formed by G558 to C800 of the T. thermophilus 16S central domain. FRET efficiencies for each state are indicated and each helix is indicated in the upper left while the positions of fluorophore labeling are indicated with stars. The designations “L” and “U” refer to the lower and upper junctions, respectively, while the “O” and “C” superscripts denote open and closed conformations, respectively. The ribosomal proteins are indicated where they exert their primary effect (see text for details).

