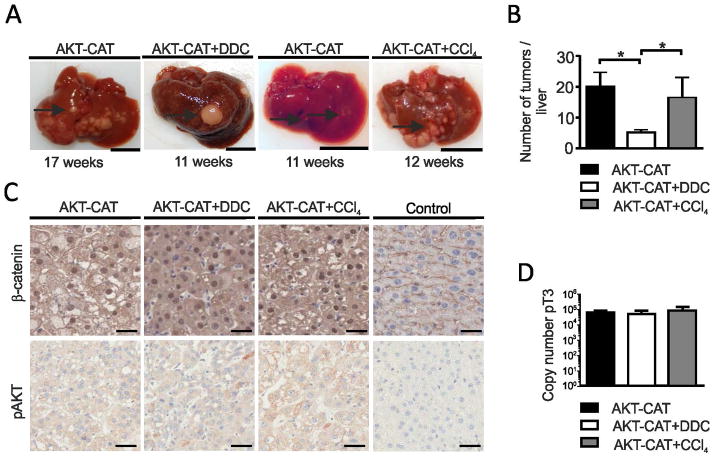
Figure 2.
AKT-CAT tumors generated in the background of chronic liver inflammation. A) Representative macroscopic liver pictures containing AKT-CAT, AKT-CAT+DDC or AKT-CAT+CCl4 tumors in weeks after hydrodynamic injection. Bar=1cm. 4 – 9 mice/group. Arrow: tumor nodule. B) Histogram with number of liver tumor nodules with a diameter of > 2mm and visible from the outside at the time of sacrifice. Mean and SEM from 4 – 9 mice/group. C) AKT-CAT, AKT-CAT+DDC, and AKT-CAT+CCl4 tumors analyzed for β-catenin and p-AKT by immunohistochemistry. Bar=50μm. D) Total copy number of pT3 plasmid/DNA in AKT-CAT, AKT-CAT+DDC and AKT-CAT+CCl4 tumors. Mean and SEM of 6 samples/group. One representative image shown from each group.

