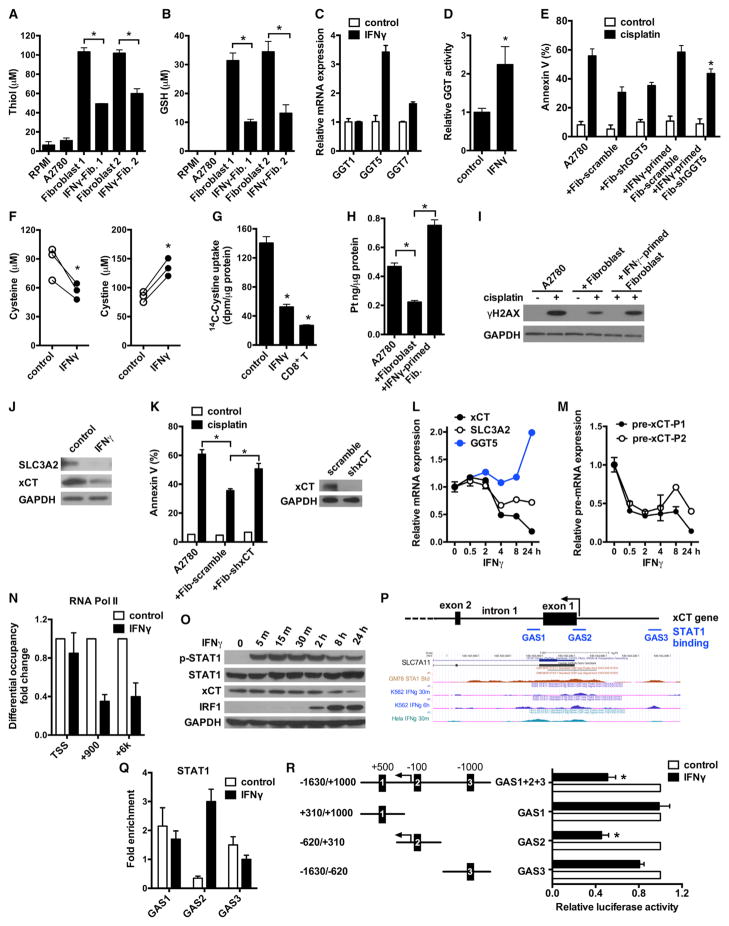
Figure 6. Effector CD8+ T Cell-Derived IFNγ Reduces GSH and Cysteine in Fibroblasts.
(A and B) Total thiol (A) and GSH (B) concentrations in samples. Fibroblasts were primed with 5 ng/ml IFNγ. Mean ± SD; n = 3, *p < 0.05.
(C) Real-time PCR quantification of GGT mRNAs in IFNγ-treated fibroblasts. Data are presented as fold change relative to control group, n = 3, mean ± SD.
(D) GGT enzymatic activity in fibroblasts after 48 hr of IFNγ treatment. Data are presented as fold change relative to control (mean ± SD), n = 3, *p < 0.05.
(E) Role of GGT5 knockdown in IFNγ-mediated protective effect. Fibroblasts expressing scramble shRNA or shGGT5 were primed with IFNγ. A2780 were cultured with these fibroblasts and cisplatin-induced tumor apoptosis was determined. n = 3, mean ± SD. *p < 0.05.
(F) Quantification of cysteine and cystine concentrations in fibroblast medium by LC-MS. Fibroblasts from three different patients were treated with IFNγ. *p < 0.05.
(G) Effect of IFNγ and CD8+ T cell supernatants on 14C-Cystine uptake by fibroblasts. Mean ± SD, n = 3. *p < 0.05.
(H and I) Platinum content (H) and γH2AX level (I) in A2780 cultured with IFNγ-primed fibroblasts in the presence of cisplatin. The intracellular platinum was measured by ICP-MS. Mean ± SD n = 3, *p < 0.05. Tumor γH2AX was detected by western blotting.
(J) Representative immunoblots of xCT and SLC3A2 in fibroblasts treated with IFNγ for 24 hr.
(K) Effect of xCT knockdown on fibroblast-mediated cisplatin resistance. A2780 were cultured with fibroblasts expressing scramble shRNA or shxCT, and followed with cisplatin treatment. Tumor apoptosis was determined by Annexin V staining. n = 3, mean ± SD. *p < 0.05. The knockdown efficiency of shxCT was determined by western blotting.
(L) Real-time PCR assays of mRNAs in fibroblasts treated with IFNγ for different time points. Data are presented as fold change relative to control (mean ± SD), n = 3.
(M) Real-time PCR assays of xCT pre-mRNA in above fibroblasts. xCT pre-mRNA was analyzed with two different primer pairs and normalized to GAPDH pre-mRNA. Mean ± SD, n = 3.
(N) ChIP of RNA Pol II in fibroblasts treated with or without IFNγ. RNA Pol II binding to xCT TSS and intragenic regions (+900 and +6 k) was quantified by qPCR. Results are expressed as the fold changes in site occupancy over control fibroblasts. Mean ± SD from two fibroblasts samples.
(O) IFNγ-induced STAT1 phosphorylation and xCT downregulation in fibroblasts were determined by western blotting.
(P) Graphics map showing the positions of primers used to quantify potential STAT1 binding sites around xCT promoter region. Lower panel shows UCSC genome browser tracks of the xCT promoter region with data for STAT1 ChIP-seq.
(Q) ChIP of STAT1 in IFNγ-treated fibroblasts. The binding of STAT1 to the three GAS regions around xCT promoter was determined. Results are expressed as the fold enrichment over IgG. Mean ± SD from two fibroblasts samples.
(R) Effect of xCT promoter GAS elements on luciferase activity. Fibroblasts were transfected with luciferase reporter constructs containing full-length xCT promoter (GAS1+2+3) or individual GAS elements. Luciferase activity was assessed after IFNγ treatment and presented as the relative activity compared with controls (mean ± SD). n = 3, *p < 0.05.
See also Figure S6.

