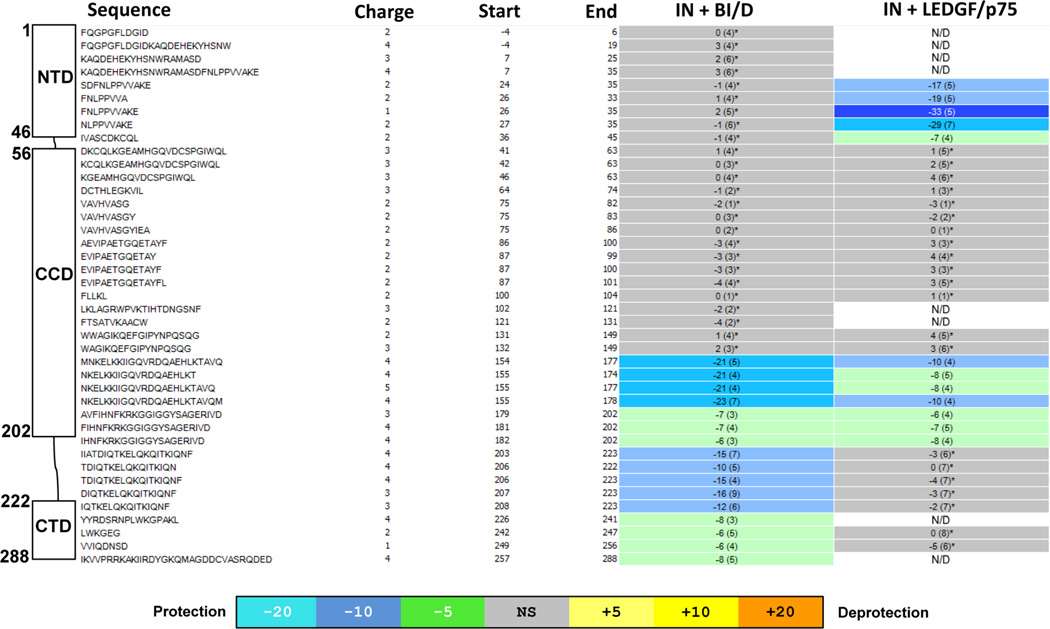
Figure 2.
HDX signature comparison for full-length IN in the presence of BI/D or LEDGF/p75. Amino acid sequences, start and end amino acid numbers, and charge states for each detected peptide are shown. The schematic presentation IN domains with respective peptides are given on the left. The peptides that did not show statistically significant difference when apo-IN is compared with IN-BI/D or IN-LEDGF/p75 complexes based on the software HDX Workbench45 are colored gray. The regions that revealed statistically significant reduction in deuterium uptake are colored green or blue according to the heat map coloring scheme used by the software HDX Workbench. N/D: these peptides were not detecteds.

