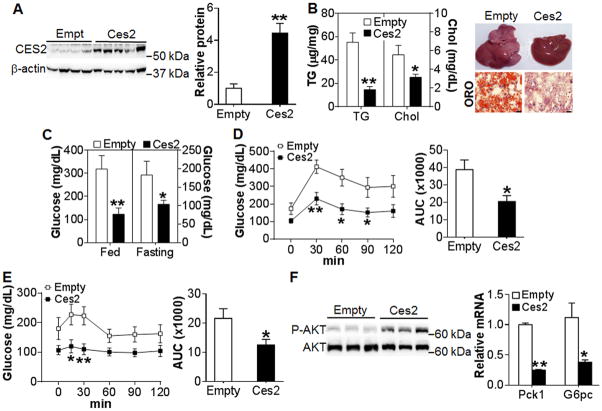
Figure 2. Restoration of hepatic Ces2 expression in db/db mice ameliorates metabolic disorder.
(A–F) db/db mice were injected i.v. with Ad-empty or Ad-Ces2 (n=7). After 13 days, mice were euthanized. (A) Hepatic protein levels (left panel) and relative CES2 protein level (right panel). (B) Hepatic TG and total cholesterol (TC) levels (left panel) and representative liver images (top) and oil red O (ORO) staining (bottom) of liver sections (right panel). Scale bars, 50 μm. (C) Postprandial glucose and fasting glucose levels on day 13. (D) GTT (left panel) and area under the curve (AUC) of GTT (right panel). (E) ITT (left panel) and AUC of ITT (right panel). (F) Hepatic phospho-AKT(Ser-473) level (left panel) and mRNA level (right panel). *P<0.05, **P<0.01

