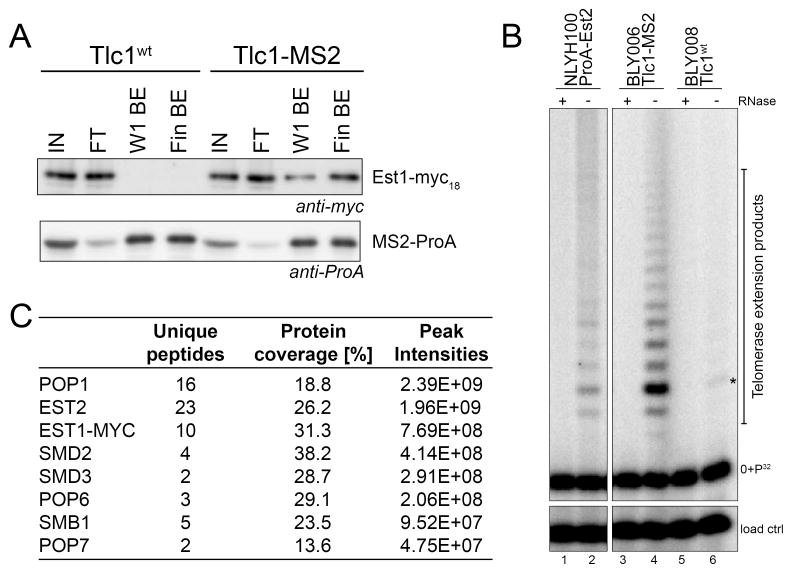
Figure 1. Mass spectrometry of endogenously expressed telomerase RNPs identifies the Pop1/Pop6/Pop7 proteins as part of active telomerase complexes.
(A) Fractions from indicated steps during the purification as analyzed by western blotting. Blots were probed with anti Myc-antibodies (top) or anti-ProA antibodies (bottom). IN: input protein extract; FT: proteins in flow through; W1 BE: proteins retained on beads after the first wash; Fin BE: final proteins on the beads fraction that was used for mass spectrometry. The TLC1 alleles used are indicated on top. (B) Left: Telomerase activity assays from cells expressing a ProA-Est2 protein and enriched with IgG as positive control. Right: Final telomerase activity on the IgG beads using the extracts from the cells as in panel A. +/− RNase: sample treatment with RNase A. 0+P32: 32P end-labeled substrate oligo. Band labeled with a star is a background band migrating at the +3 position. (C) Combined results from three independent mass spectrometry determinations. Proteins identified are listed in order of the sum of peak-intensities (right column). The total number of unique peptides for each protein and the total protein coverage are indicated. Only proteins that were detected exclusively in the MS2-tagged Tlc1 fraction were considered and the top eight proteins are listed. For a more extensive list, see Figure S1A.

