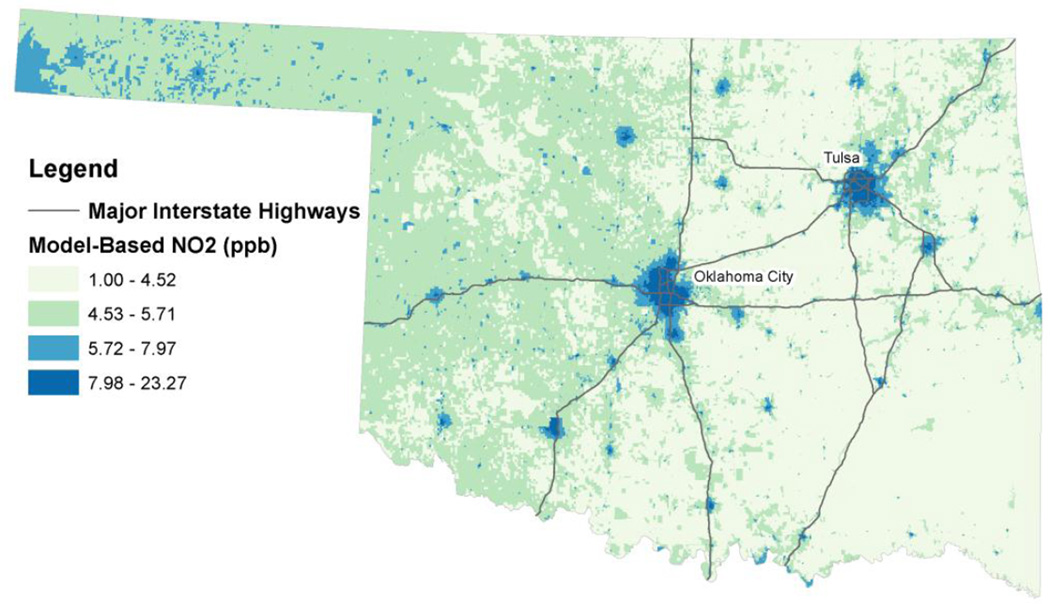
Figure 1.
Distribution of NO2 in Oklahoma using 2006 estimates from the satellite-based land-use regression model developed by Novotny et al. (2011).
Source: Major interstate highways were obtained from the National Transportation Atlas Databases for the United States published by the Federal Highway Administration.

