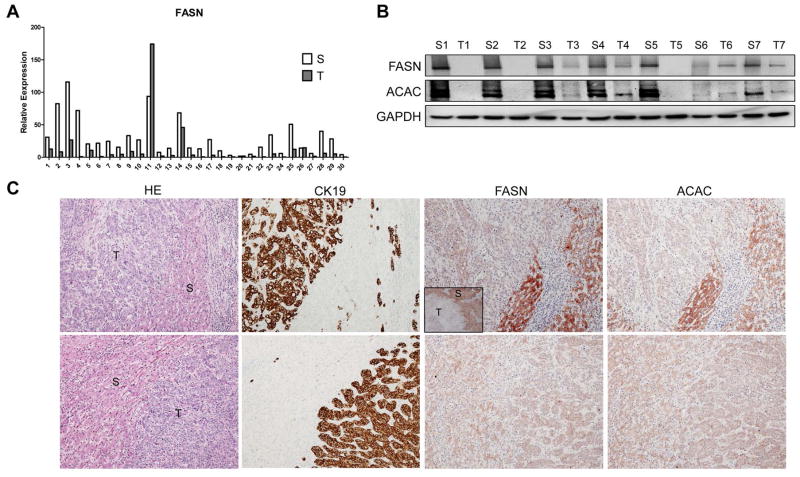
Figure 1.
Expression of FASN in human ICC samples. (A) qRT-PCR analysis of FASN mRNA expression in 30 paired human ICC (T) and non-tumor surrounding liver tissues (S); (B) Representative Western blot analysis of paired non-tumorous surrounding livers (S) and ICC (T) showing the downregulation of FASN and its upstream inducer, ACAC, in human ICC. GAPDH was used as a loading control. (C) Immunohistochemical patterns of FASN and ACAC in human ICC specimens. Upper panel, ICC (T) showing downregulation of FASN and ACAC when compared to the non-neoplastic counterpart (S). Lower panel, equivalent immunoreactivity for FASN protein in an ICC and surrounding non-tumorous liver. CK19 was used as a cholangiocellular marker. Original magnification: 40X in inset; 100X in all the other pictures. Abbreviation: HE, hematoxylin and eosin staining.

