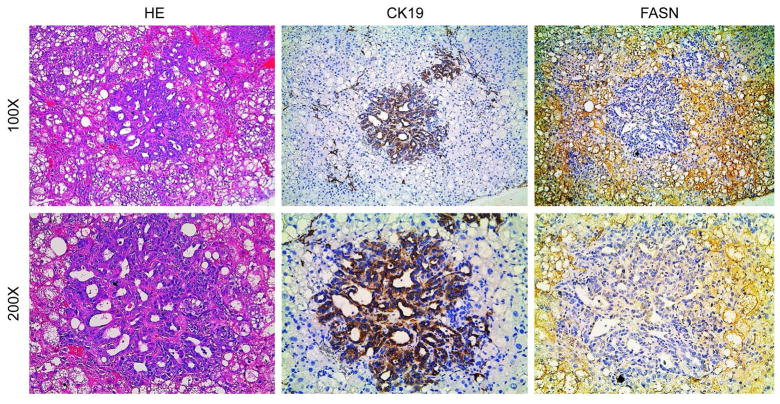
Figure 3.
FASN expression patterns in cholangiocellular lesions from AKT/Ras mice, as detected by immunohistochemistry. Upper panel, immunoreactivity for FASN is low in CK19(+) cholangiocellular lesions, whereas lipid-rich preneoplastic and neoplastic lesions exhibit strong immunoreactivity for FASN. Lower panel, details of the pictures shown in the upper panel. Original magnification: 100X in the upper panel; 200X in the lower panel. Abbreviation: HE, hematoxylin and eosin staining. Liver tumor samples from 5 AKT/Ras injected mice were analyzed by immunostaining.

