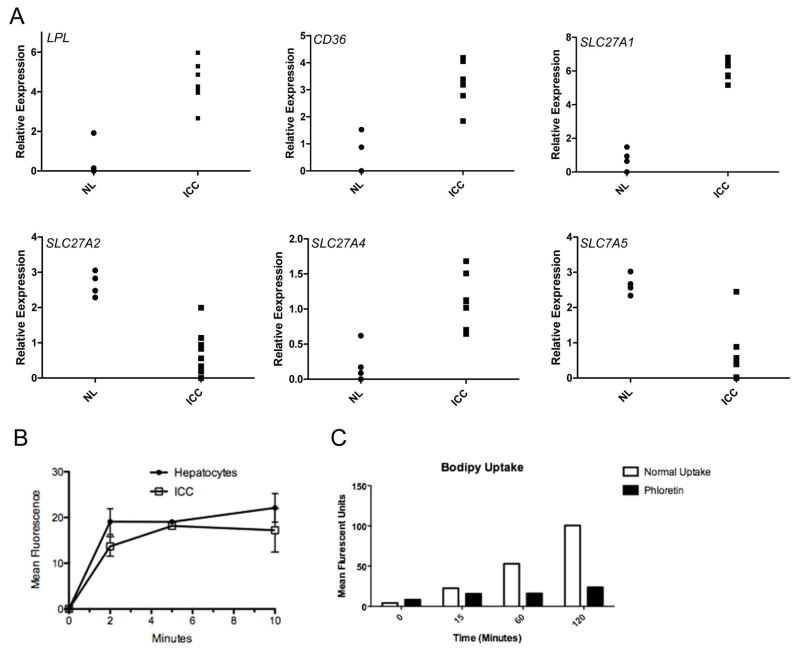
Figure 7.
Expression of fatty acid transporters in human and mouse ICC cells. (A) Expression of CD36, LPL, SLC27A1, SLC27A2 and SLC27A5 in AKT/NICD tumor tissues (ICC) versus normal mouse liver tissues (NL). (B) Fatty acid uptake measured with a fluorescent fatty acid analogue, BODIPY® 500/510 C1, C12 (4,4-Difluoro-5-Methyl-4-Bora-3a,4a-Diaza-s-Indacene-3-Dodecanoic Acid), in primary cell suspension from AKT/NICD ICC cells as well as normal mouse hepatocytes. (C) Uptake of fluorescent fatty acid analogue in HUCCT1 cells with or without phloretin, β-(4-Hydroxyphenyl)-2,4,6-trihydroxypropiophenone, an inhibitor of active transport.

