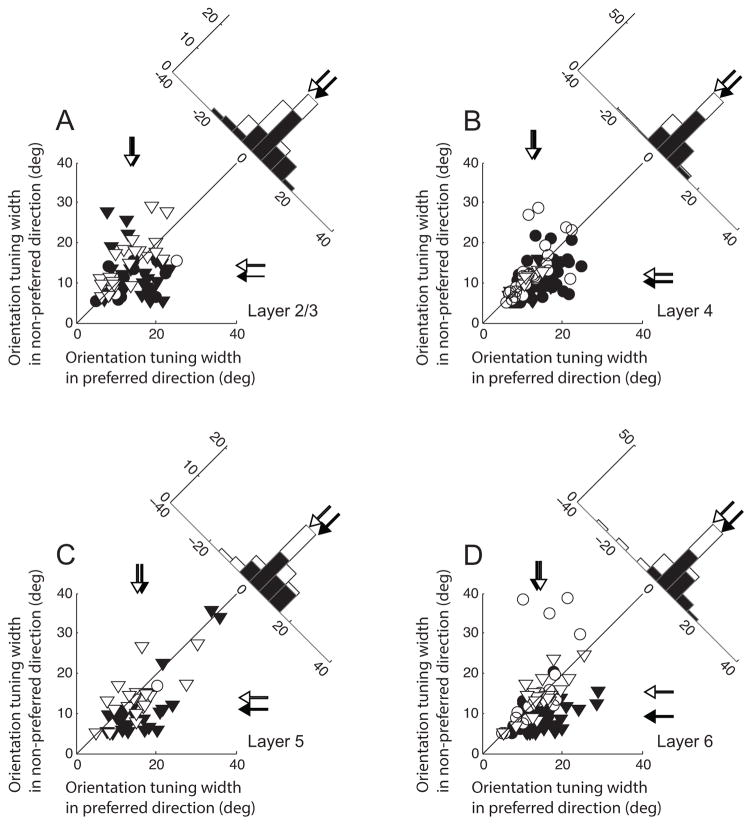
Figure 5. Comparisons of orientation tuning widths between preferred and non-preferred directions of motion.
A. Data from 66 units in layer 2/3. X- and Y-axes indicate orientation tuning widths (parameter σ of Gaussian fitting curve) obtained for preferred and non-preferred directions of motion, respectively. Circles and triangles represent simple and complex cells, respectively. Direction selective units (filled symbols, DSI≥0.5) and non-selective cells (open symbols, DSI<0.5) are differentially indicated. Arrows for each axis indicate mean values of corresponding shaded units. The histogram in the upper-right shows the distribution of differences of orientation tuning widths between two opposite directions (preferred and non-preferred directions). For direction selective (but not non-selective) cells, orientation tuning curves for non-preferred directions tend to be narrower than those for preferred directions. B. Data from 110 cells in layer 4. The same format is used as in A. C. Data from 47 cells in layer 5. The same format is used as in A. D. Data from 98 cells in layer 6. The same format is used as in A. Note that the amount of decrease of orientation tuning width in the non-preferred direction differs depending on cortical layers. It increases gradually in the direction of visual information flow (layer 4 → layer 2/3 → layer 5 → layer 6).

