FIGURE 3.
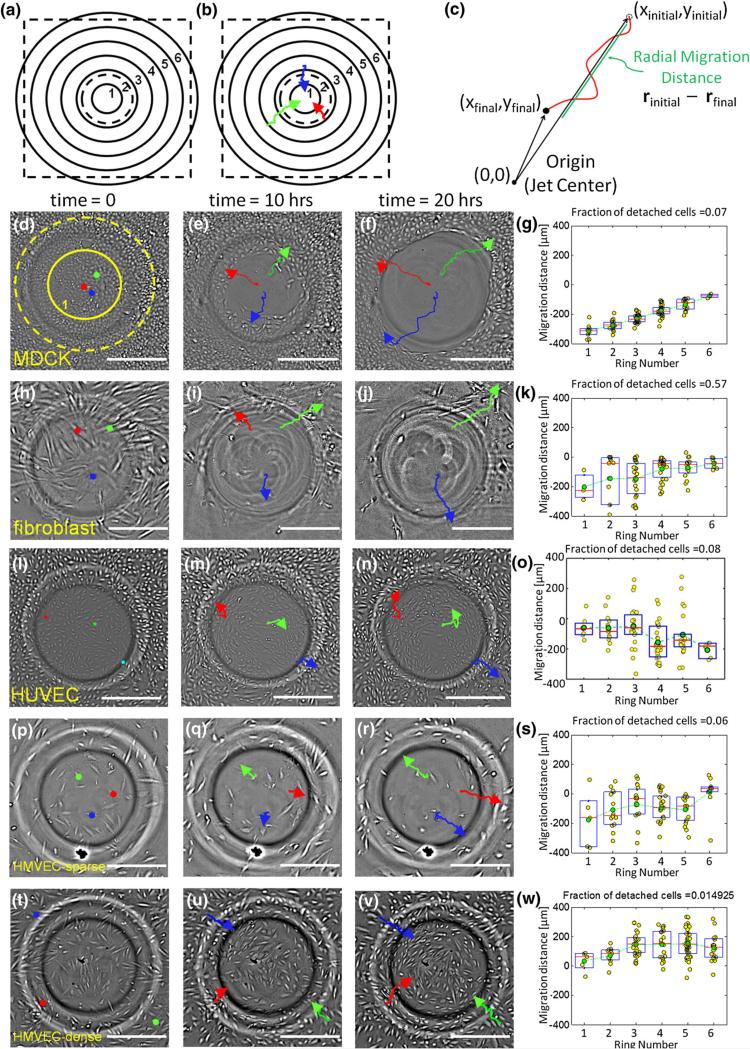
Cell-type specific response to WSSGs. (a) Regions concentric to the jet orifice center (flow stagnation point) within the microscope field of view (dashed black square) are binned in 185 μm radius rings, with ring 1 closest to the jet center. The impinging jet radius (black dashed circle) and ring 1 are also overlaid, to scale, on d. (b) Quantification of cell migration in response to the WSSG gradient. The positions of representative cells (red, blue, green) were manually determined at 20 min intervals during the 20 h movies. In this illustration cells move inward toward the position on the dish directly beneath the impinging flow. (c) The radial cell migration distance is defined by calculating the difference between the initial and final radial distances from the jet center. Here, a positive migration distance indicates movement toward the jet center (against the flow direction), while a negative migration distance indicates movement away from the jet center (with the flow direction). Response to an impinging flow field (4.5 mL/min, peak WSS 72 dynes/cm2) for MDCKs (d–g), HFFs (h–k), HUVECs seeded at a density that establishes cell–cell contacts (l–o), sparsely seeded lymphatic HMVECs (p–s), and lymphatic HMVECs seeded at a density that establishes cell–cell contacts (t–w). d, h, l, p, and t show the cells before the onset of flow. Three cells are highlighted with colored circles. e, i, m, q, and u show the images of cells after 10 h of exposure to the flow, and f, j, n, r and v show the same fields of view after 20 h. The migration paths of cells are tracked with colored lines. Final cell positions are shown with an arrowhead. g, k, o, s and w show total displacements over 20 h for 100 cells as a function of their initial position (see panel B). MDCKs, HFFs, HUVECs and sparsely seeded HMVECs migrate with the flow direction. In contrast, more densely seeded HMVECs migrate upstream, against the flow direction. (Scale bar = 300 μm).

