FIG. 4.
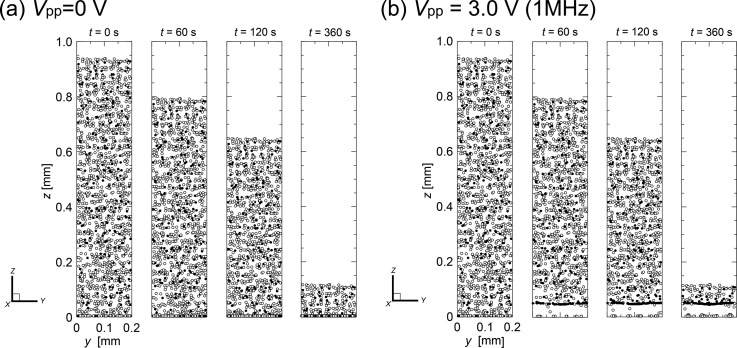
Sequences of instantaneous snapshots of cell distribution viewed from the downstream end of the unit volume toward the upstream at times t = 0, 60, 120, and 360 s following the application of AC voltage of peak-to-peak values (a) Vpp = 0 V (no electric field) and (b) Vpp = 3.0 V; the frequency was 1 MHz. The open and closed circles in the figure indicate the live and dead cells, respectively.

