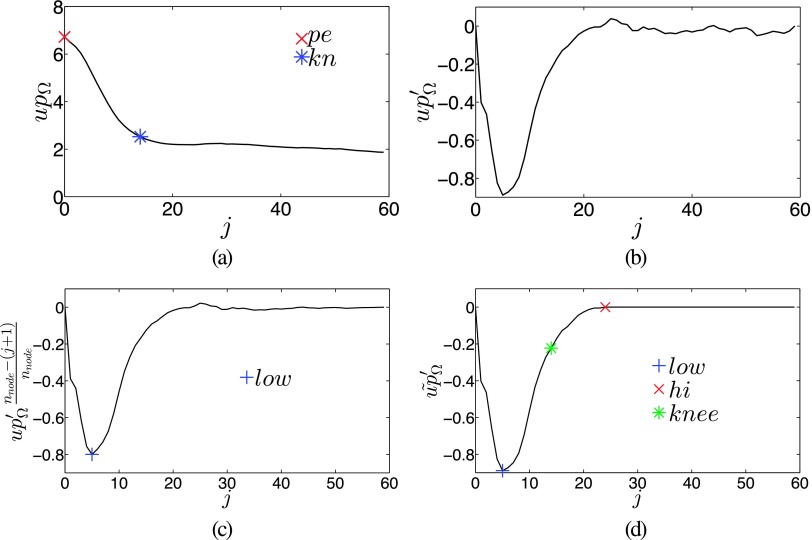
FIG. 4.
Calculation of local image statistics. (a) Plot of upΩ with points of interest pe and kn. (b) The gradient of upΩ. (c) The gradient with added center bias to detect jlow. (d) Deriving jhi from . Points on the curve that are labeled with low and hi mark the location of indices jlow and jhi, respectively.

