
Fig. 3.
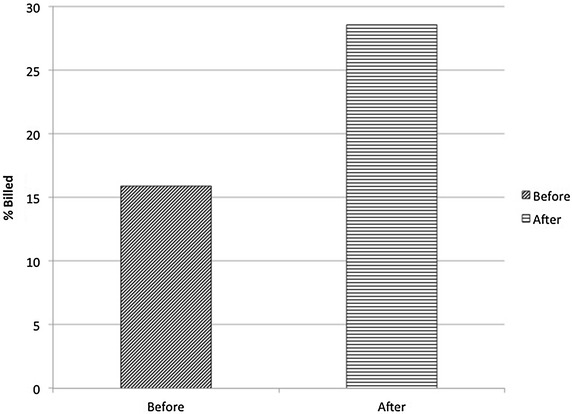
The change in the percentage of scans billed after being reported to the medical coders by the department pre- and post-task force intervention. X-axis illustrates pre- and post-intervention periods (dark slanted hashed bar pre-intervention data; horizontal hashed bar post-intervention data). Y-axis represents the percentage of examinations billed