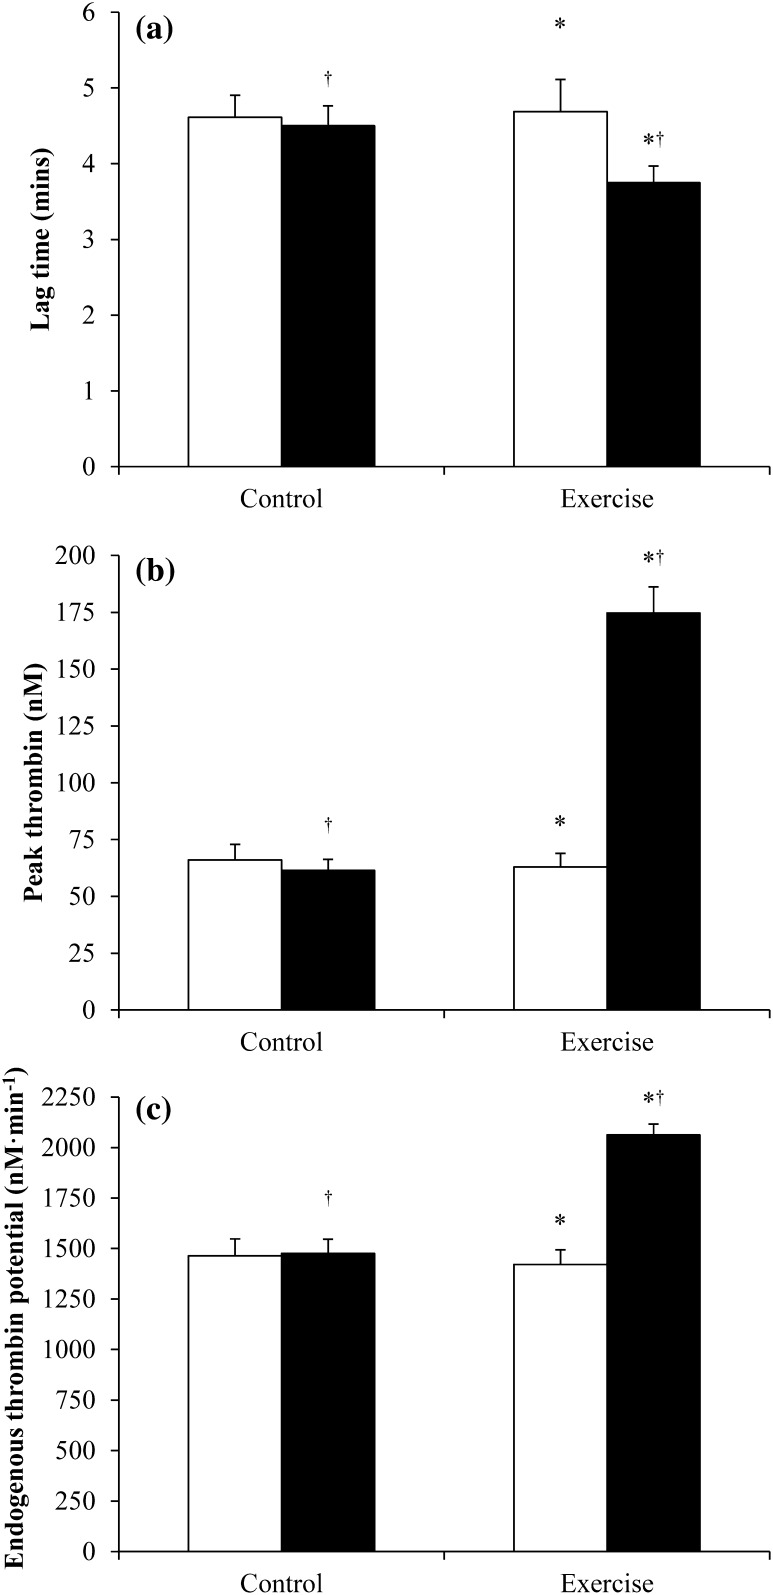
Fig. 2.
Plasma thrombin generation parameters measured pre- (open square) and post- (closed square) intervention in the control and exercise conditions (n = 16): a lag time; b peak thrombin; c endogenous thrombin potential. Values are mean (SEM). *Significant difference between exercise and control conditions, main effect condition P ≤ 0.03; †significant difference between pre- and post-intervention, main effect time P ≤ 0.003

