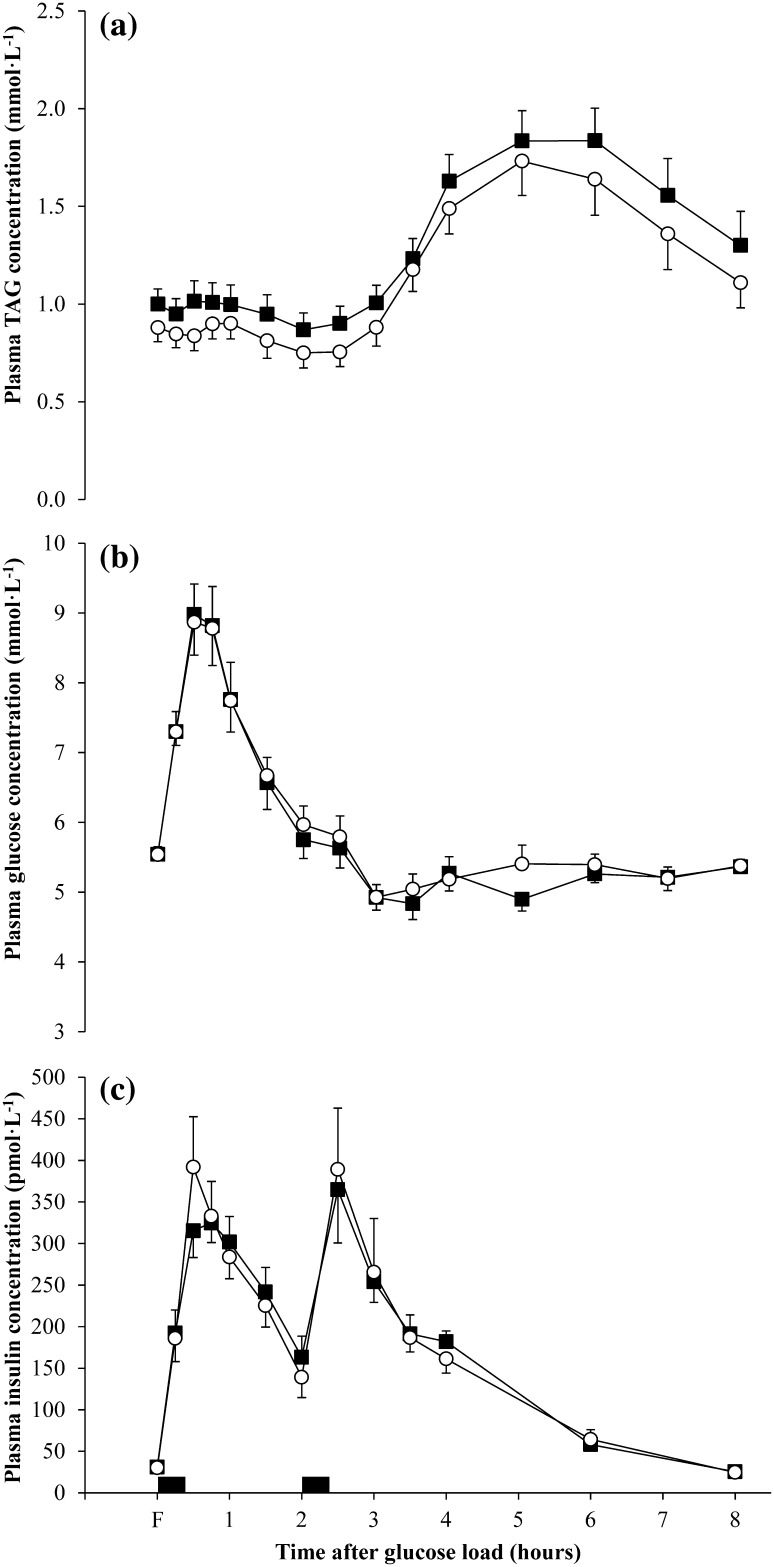
Fig. 3.
Fasting (F) and postprandial plasma concentrations in the control (closed square) and exercise (open circle) conditions (n = 16): a triacylglycerol (TAG); b glucose; c insulin. Values are mean (SEM). Black rectangles denote consumption of a glucose load and standardised meal at 08:00 and 10:00, respectively. There was a significant main effect of condition for TAG (P < 0.001)

