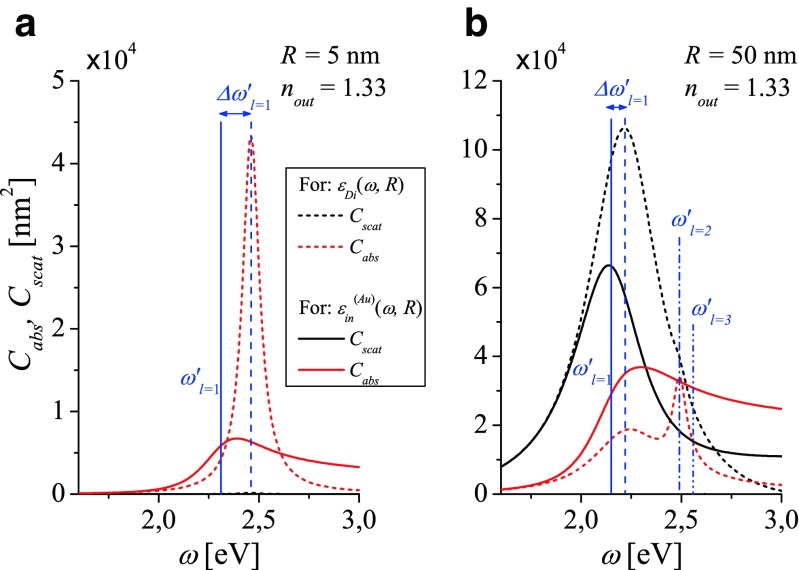
Fig. 5.
Comparison of the absorption C abs (red lines) and scattering C scat (black lines) cross sections calculated for different models of the dielectric function; dashed lines: for ε Di(ω, R); solid lines: for ε (Au)(ω, R) for gold nanospheres with the radius (a) R = 5 nm and (b) R = 50 nm embedded in water. Vertical solid and dashed lines show correspondingly the position of LSP resonance frequencies resulting from the dispersion relation (9) for both models of the dielectric function

