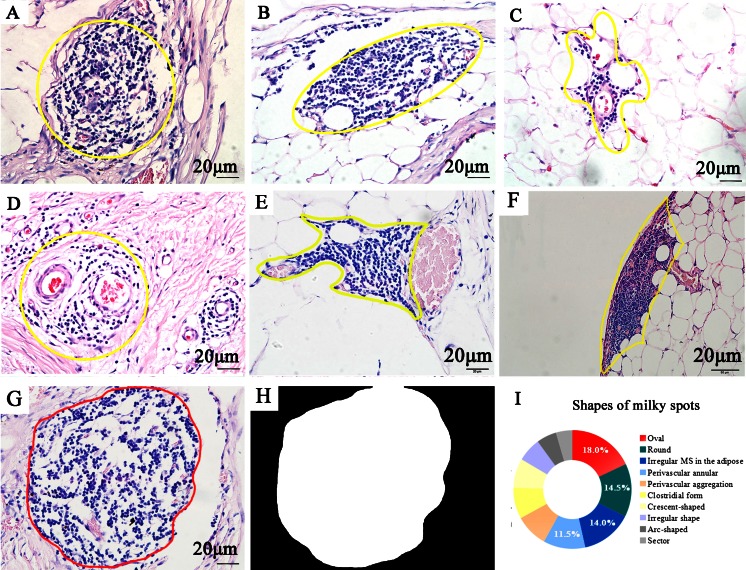
Fig. 1.
H&E staining of milky spots. The yellow frame is used to show the gross morphology of MS. a Round. b Oval. c Irregular form in adipose tissues. d Perivascular annular. e Perivascular aggregation. f Clostridial form. g, h Computer methods were used to convert HE images into binary images for the calculation of MS perimeter. i Proportions of MS shapes (a–h ×400, scale bar = 20 μm)

