
Figure 2.
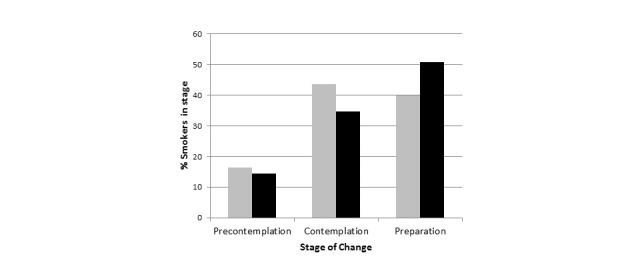
Distribution of stages of change before and after the mobile app use (gray bars: before the app use, black bars: after the app use; see detailed description in the text).
Official websites use .gov
A
.gov website belongs to an official
government organization in the United States.
Secure .gov websites use HTTPS
A lock (
) or https:// means you've safely
connected to the .gov website. Share sensitive
information only on official, secure websites.
Distribution of stages of change before and after the mobile app use (gray bars: before the app use, black bars: after the app use; see detailed description in the text).