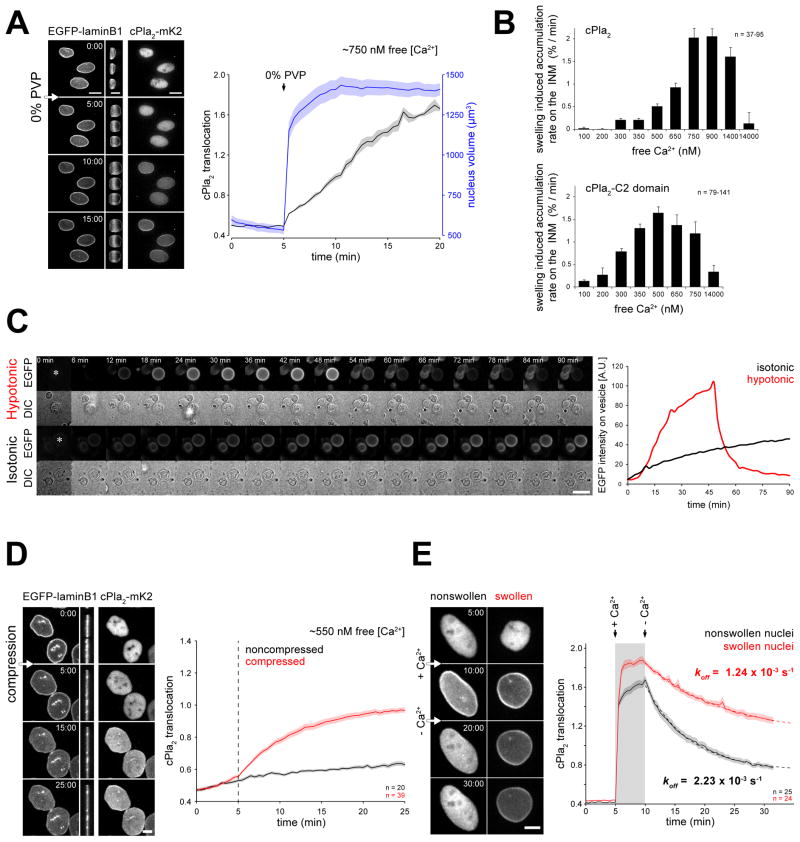
Figure 5. Nuclear swelling or compression promotes cPla2 accumulation on the INM.
(A) Left panel, confocal images of cPla2-mK2 and EGFP-laminB1 fluorescence in permeabilized HeLa cells. Cells were treated with digitonin for 10 min before imaging in medium containing ~750 nM free [Ca2+] and 2.5% PVP. Note the nuclear swelling induced by PVP-washout at t = 5 min, visible on the side-view projections and quantified on the right (outlines of nuclei are marked by dashed white line). Right panel, average plot of nuclear volume and cPla2-mK2 translocation of the depicted nuclei. Note that swelling coincides with the onset of cPla2-mk2 accumulation on the nuclear envelope (also see Movie S5).
(B) Rate of cPla2 (top) and cPla2-C2-domain (bottom) accumulation on the nuclear membrane in response to nuclear swelling at different free Ca2+ concentrations (see Methods for details and Figure S4, S5). Error bars, SEM. n, number of cells.
(C) Left panel, representative time-lapse montage of GVs filled with PBS + 300 mM Sucrose immersed in PBS (hypotonic- relative to GV interior) or PBS + 300 mM Sucrose (isotonic) in the presence of 0.5 mM CaCl2 and 9.3 μM recombinant cPla2-C2-EGFP (also see Movie S6). Scale bar, 20 μm. Right panel, average EGFP intensity measured in a 5x5 μm square center region of the vesicles indicated by a white asterisk in the first frame.
(D) Representative confocal images and quantification of cPla2-mK2 accumulation on the nuclear membrane after mechanical compression (also see Movie S7). Cells were permeabilized with digitonin for 5 min before imaging in medium containing ~550 nM free [Ca2+] and 2.5% PVP. The nuclei were then compressed (red) or left untreated (black). Note the nuclear compression at t = 5 min, visible on the side-view projections of the EGFP-laminB1 fluorescence images. Error bars, SEM. n, number of cells.
(E) Representative confocal images and quantification of cPla2-mK2 dissociation from the nuclear membrane after Ca2+-washout (also see Movie S8). Cells were first permeabilized in intracellular medium containing 2.5% PVP at low free [Ca2+] (0.1 μM). Then, the supernatant was swapped to medium with high free [Ca2+] (14 μM) with or without PVP to allow the nuclei to maintain their size or swell, respectively. After 5 min, when cPla2-mK2 was fully translocated to the INM, cells were washed with low [Ca2+] medium with or without PVP, which initiated cPLA2 dissociation from the nonswollen and swollen nuclei. The apparent koff of cPla2-mK2, indicating membrane debinding, was calculated from an exponential fit (dashed line). Scale bars, 10 μm. Error bars, SEM. n, number of cells.

