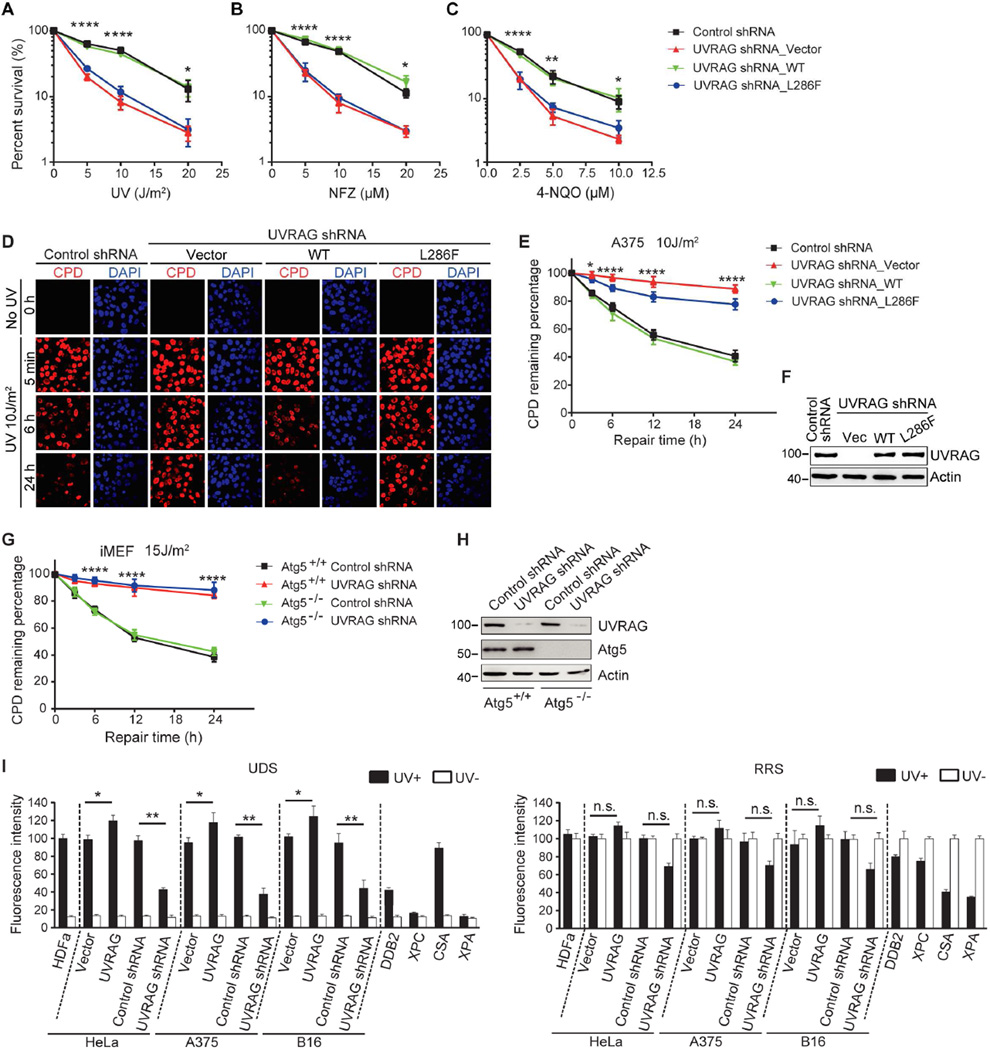
Figure 1. The Role of UVRAG In UV-irradiation Sensitivity and NER.
(A–C) UV sensitivity of A375 cells upon UVRAG inhibition. A375 cells expressing control shRNA or UVRAG-specific shRNA were transduced with empty retroviral vector (UVRAG shRNA_Vector), with retroviral vector expressing WT human UVRAG (UVRAG shRNA_WT), or with retroviral vector expressing UVRAG L286F point mutant (UVRAG shRNA_L286F). Cells were exposed to the indicated doses of UV-C (A), UV mimetic agents nitrofurazone (NFZ; B) and 4-nitroquinoline-1-oxide (4-NQO; C), followed by colony survival assay. Data are mean ± SD from three independent experiments. *p < 0.05; **p < 0.01; ****p < 0.0001 (UVRAG shRNA_Vector vs. Control shRNA).
(D–F) UVRAG is required for UV-induced CPD repair. A375 cells expressing control shRNA or UVRAG-specific shRNA were transduced with empty retroviral vector (UVRAG shRNA_Vector), WT human UVRAG (UVRAG shRNA_WT), or the L286F mutant (UVRAG shRNA_L286F). Cells were UV-C treated and recovered for a period of time as indicated. UV-induced DNA damage was visualized using CPD counterstaining. Representative images are shown in (D). Quantification of the percentage of remaining CPD per cell relative to that of 0 hr after UV-C in each sample is plotted (E). UVRAG expression was assessed by immunoblotting and compared to actin levels (F). Data shown represent mean ± SD; n = 200 cells, data pooled from three independent experiments. Scale bar, 20 µm. *p < 0.05; ****p < 0.0001 (UVRAG shRNA_Vector vs. Control shRNA).
(G and H) UVRAG knockdown delayed UV-induced CPD repair in Atg5-knockout iMEFs. The Atg5+/+ and Atg5−/− immortalized MEF cells were transfected with control shRNA or UVRAG-specific shRNA and then subjected to UV-C. The percent distribution of CPD foci before UV, and 5 min, 6 hr, and 24 hr post-UV was determined (G). Protein levels of UVRAG and Atg5 are shown (H). Scale bar, 20 µm. Data are mean ± SD from three independent experiments. ****p < 0.0001 (Atg5−/− UVRAG shRNA vs. Atg5−/− Control shRNA).
(I) Effect of UVRAG on UDS and RRS activity. A375, B16, and HeLa cells expressing an empty vector, Flag-UVRAG, control shRNA, or UVRAG-specific shRNA were UV-C-irradiated and subjected to UDS (left) and RRS (right) assays. UDS and RRS activities in normal HDFα cells, DDB2-deficient, XPC-deficient, CSA-deficient, and XPA-deficient cells served as controls. Filled bars, UV-irradiated; open bars, no UV. Typical UDS and RRS images are provided in Figure S3E. Data shown represent mean ± SD from three independent experiments. *p < 0.05; **p < 0.01; n.s., not significant.
See also Figure S1–S3 for additional information.

