
Table 2.
Net reclassification table of patients according to PCT and lactate values
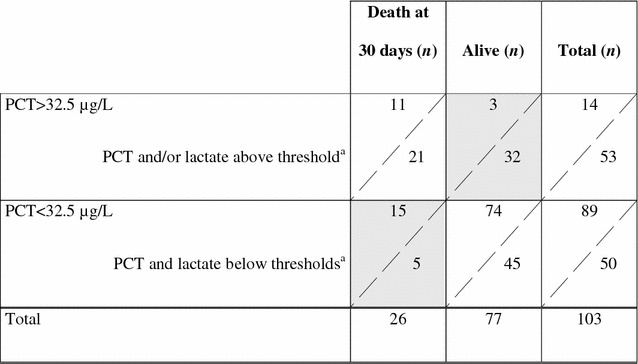
NB. This is the practical representation of both the relationship between false positive and false negative (gray zones), and the magnitude of the gain of predictability in quantitative terms (number of patients): here, the strategy PCT + lactates provokes a decrease in false negative (from 15 to 5) but a concomitant increase in false positives (from 3 to 32). The consequence is that sensitivity is improved (from 11/26 = 42.3 % to 21/26 = 80.8 %), but consequently specificity is dramatically decreased (from 74/77 = 96.1 % to 45/77 = 58.4 %)
Thus, the NRI calculation is: NRI = (80.8 + 58.4) − (42.3 + 96.1) = 0.8 %
a32.5 µg/L for PCT, 2.2 mmol/L for lactate