Fig. 2.

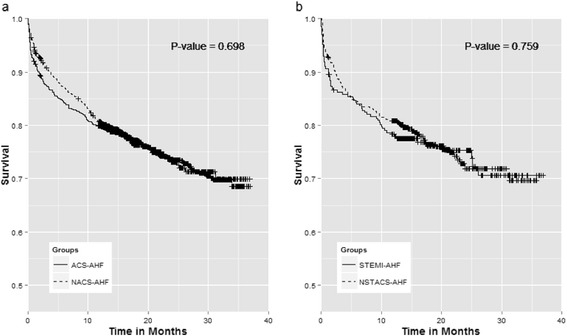
Kaplan-Meier survival curves between: a acute heart failure with (solid line) and without acute coronary syndrome (dashed line), b ST elevation myocardial infarction (solid line) and Non ST acute coronary syndrome (dashed line)

Kaplan-Meier survival curves between: a acute heart failure with (solid line) and without acute coronary syndrome (dashed line), b ST elevation myocardial infarction (solid line) and Non ST acute coronary syndrome (dashed line)