Fig. 5.

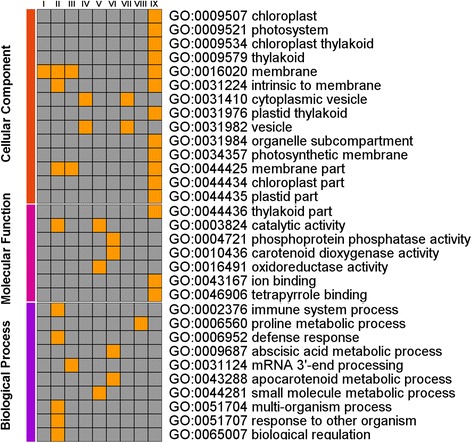
GO terms distribution in nine clusters (I ~ IX). Each column indicated each cluster, and each row indicated GO degree of enrichment. Red indicated greater enrichment, whereas the grey indicated lower enrichment

GO terms distribution in nine clusters (I ~ IX). Each column indicated each cluster, and each row indicated GO degree of enrichment. Red indicated greater enrichment, whereas the grey indicated lower enrichment