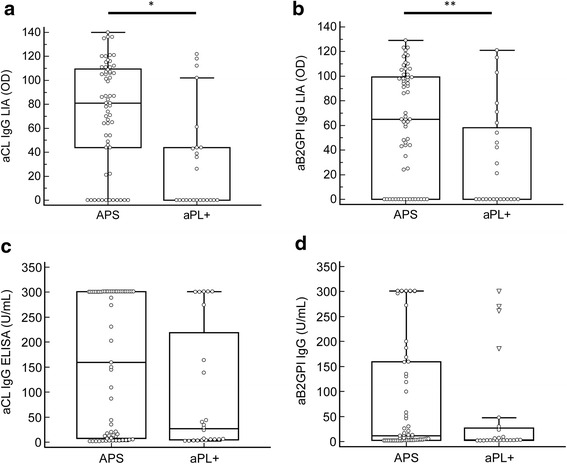
Fig. 7.

Comparison of quantitative anti-cardiolipin (aCL) IgG (a) and anti-beta 2 glycoprotein I (aß2GPI) IgG (b) analysis by line immunoassay (LIA) and enzyme-linked immunosorbent assay (ELISA) (c, d, respectively) in patients with antiphospholipid syndrome (APS) (n = 61) and antiphospholipid antibody-positive carriers (aPL+) (n = 24). In the box and whisker plots, outlier values are defined as values that are lower than the lower quartile minus three times the interquartile range, or higher than the upper quartile plus three times the interquartile range, displayed as triangles. *P = 0.0005; **p = 0.0066
