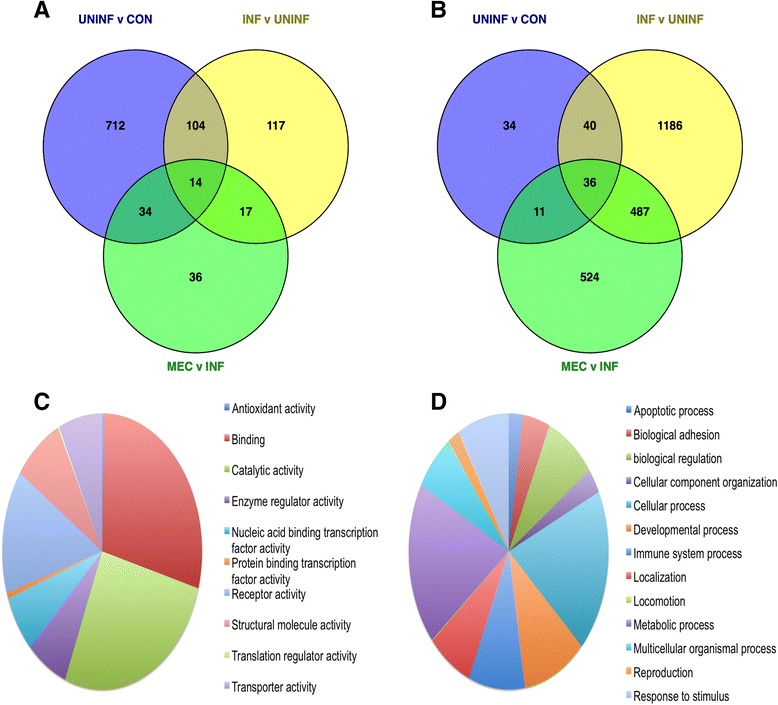
Fig. 2.

Overview of differential gene expression in PRRSV-inoculated reproductive tract. a and b Venn diagrams showing the numbers of differentially expressed genes (DEGs) in endometrium (a) and fetal thymus (b) for each of the three between-group contrasts (UNINF v CON, INF v UNINF, and MEC v INF). c and d Pie charts of DEGs identified across all six contrasts grouped by molecular activity (c) and biological process (d) terms
