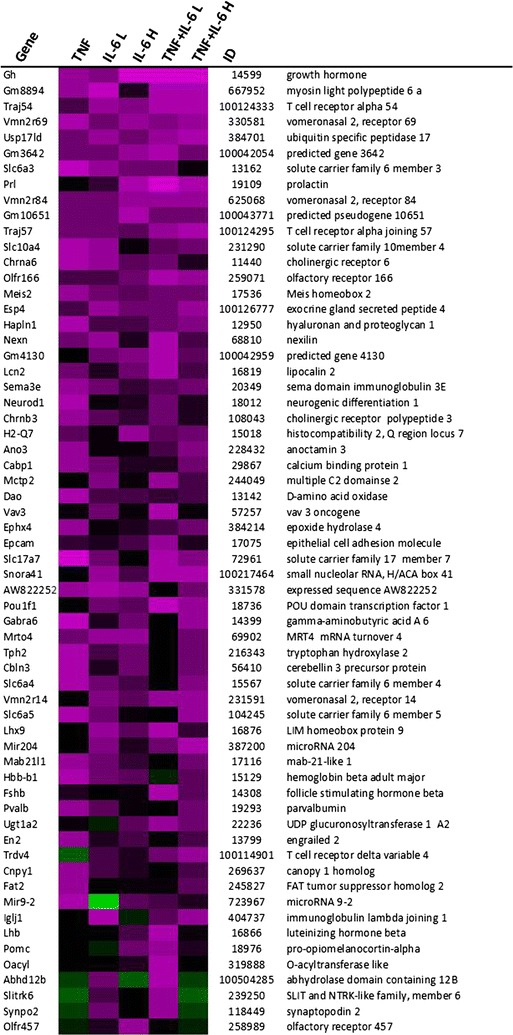
Fig. 5.

Gene expression changes in hypothalamus after ip injection with TNFα, IL-6 or both. Top upregulated genes and top downregulated genes in treated groups compared to control group. Each row represents a gene and each column represents a group of animals. Magenta colour indicates genes that were higher expressed as control and green colour indicates genes that were lower expressed as the control. Black indicates genes whose expression was similar to compared to control. ID: Entrez ID
