
Fig. 2.
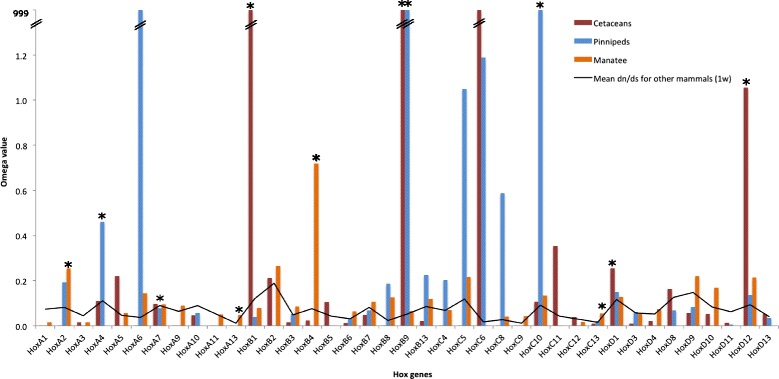
The ω values for Hox genes in cetaceans, pinnipeds, sirenian and average value for the remaining mammals (solid line) derived from the two-ratio model. Asterisks indicate those Hox genes statistically inferred as evolving under positive selection or those having significantly higher evolutionary rates