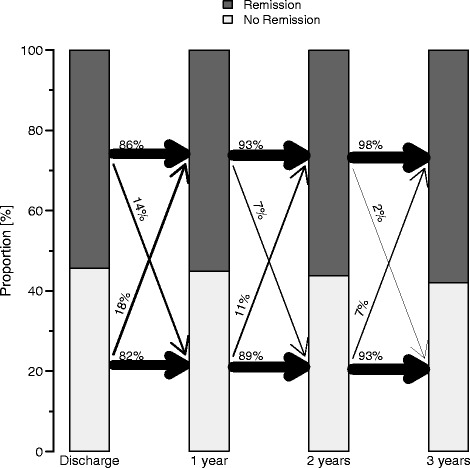
Fig. 2.

The year to year movement from discharge on until the end of the 3-year follow-up of patients being in HMAD-17 remission (dark) or non-remission (light) for the LOCF sample (N = 784). The width of the arrows corresponds to the magnitude of the percentage. For example, from discharge to year one 86 % stayed in remission whereas 82 % stayed non-remitters. 14 % of non-remitted patients became remitters and 18 % of remitted patients lost remission at the 1-year follow-up
