
Fig. 4.
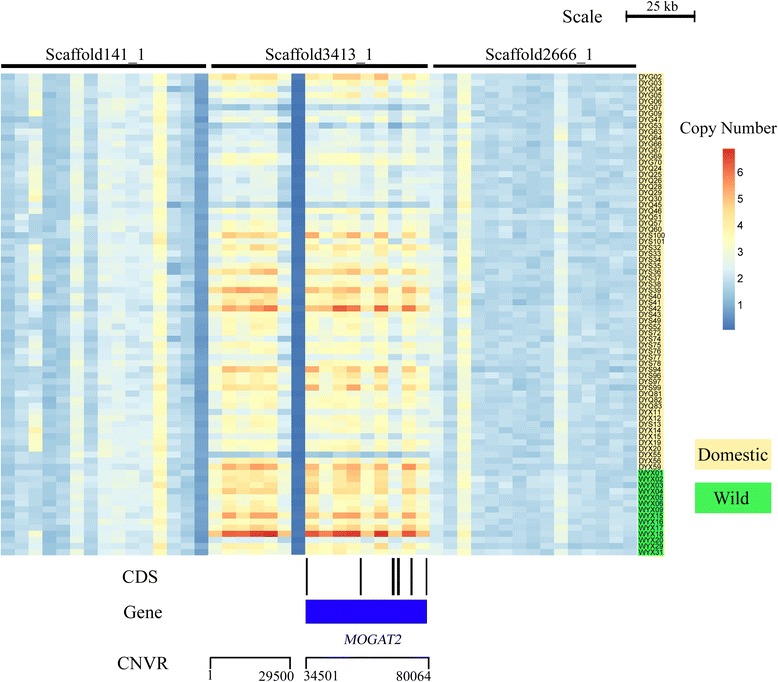
Heatmap of CNVR with MOGAT2 gene located in scaffold3413_1. Average read depths were plotted every 5 kb of the genome. The CNVR with the MOGAT2 gene represents different average normalized read depths of a specific region. The domestic yak (yellow) exhibited a lower copy number than the wild ones (green). CDS and gene are shown at the bottom (black rectangle, coding sequence; blue box, whole gene)