Fig. 4.

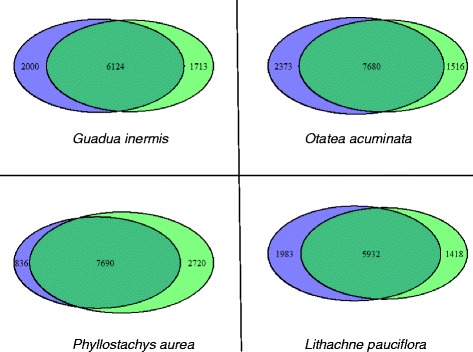
Venn diagrams reporting the number of Pfam domains that are unique to each assembly and shared by them both. Diagrams are separated by taxon. Venn diagrams are proportional to their values and were generated using the VennDiagram R-package

Venn diagrams reporting the number of Pfam domains that are unique to each assembly and shared by them both. Diagrams are separated by taxon. Venn diagrams are proportional to their values and were generated using the VennDiagram R-package